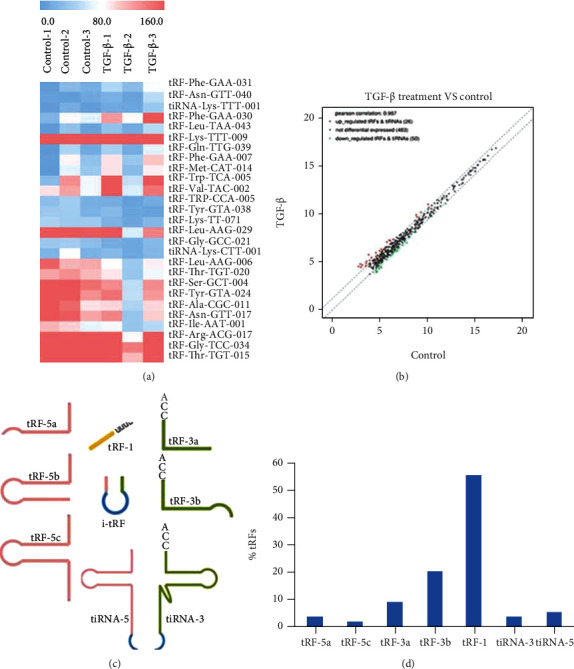
Figure 2.

Differentially expressed tRFs in TGF-β-treated HT29 cells. (a) The representative differentially expressed tRFs and tiRNAs were compared in a heat map. (b) The scatter plot between the control group and the TGF-β-treated cell group. (c) Schematic representation of tRFs and tiRNAs. (d) The contribution of each subtype of differentially expressed tRFs and tiRNAs in TGF-β-treated HT29 cells.
