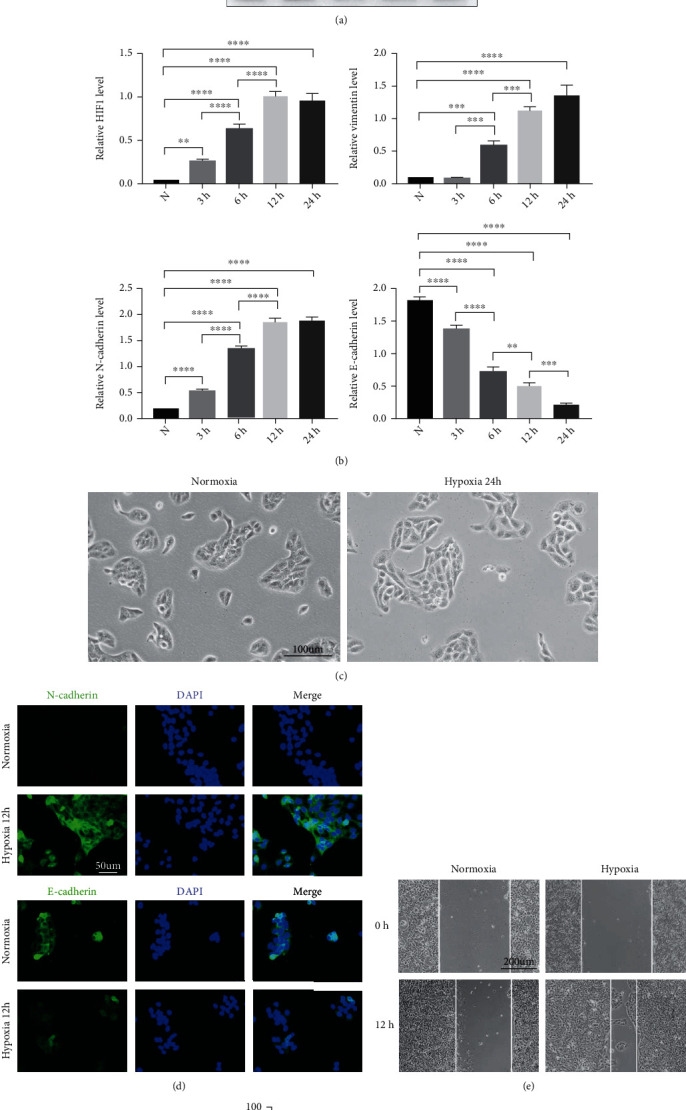
Figure 1.

Hypoxia induced EMT and increased the motility of HaCaT cells. (a, b) Western blotting (a) and quantitative analysis (b) were employed to analyse the expression levels of HIF1, vimentin, N-cadherin, and E-cadherin in normoxia-treated (N) and hypoxia-treated HaCaT cells at the indicated time points. β-Actin was used as the loading control. (c) Representative pictures of change in cell phenotype in normoxia-treated and hypoxia-treated HaCaT cells up to 24 h are shown. Bar, 100 μm. (d) Representative images of fluorescence staining of the indicated HaCaT cells. Bar, 50 μm. (e, f) Scratch assays (e) and quantitative analysis (f) were performed using the indicated cells under hypoxia or normoxia for 12 h. Bar, 200 μm. Mean ± SEM. n = 3. ∗∗P < 0.01, ∗∗∗P < 0.001, and ∗∗∗∗P < 0.0001.
