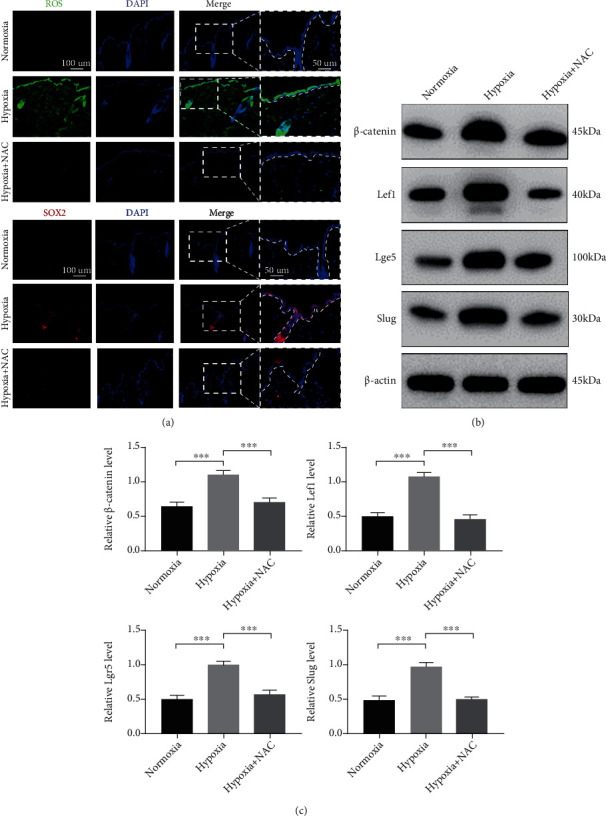
Figure 5.

Increased ROS production induced by hypoxia drove epidermal SOX2 and β-catenin expression and EMT in vivo. (a) The levels of ROS (green) and expression of SOX2 (red) were determined by IF staining. Representative images show typical ROS and SOX2 levels. The magnification of the dotted boxes is shown on the right. Additionally, the epithelium is marked with a dotted line. Bar, 100 and 50 μm. Western blotting (b) and quantitative analysis (c) were performed to analyse the expression of β-catenin, Lef1, Lgr5, and Slug in cultured skin subjected to hypoxia with NAC. β-Actin was used as the loading control. Mean ± SEM. n = 3. ∗P < 0.05, ∗∗P < 0.01, ∗∗∗P < 0.001, and ∗∗∗∗P < 0.0001.
