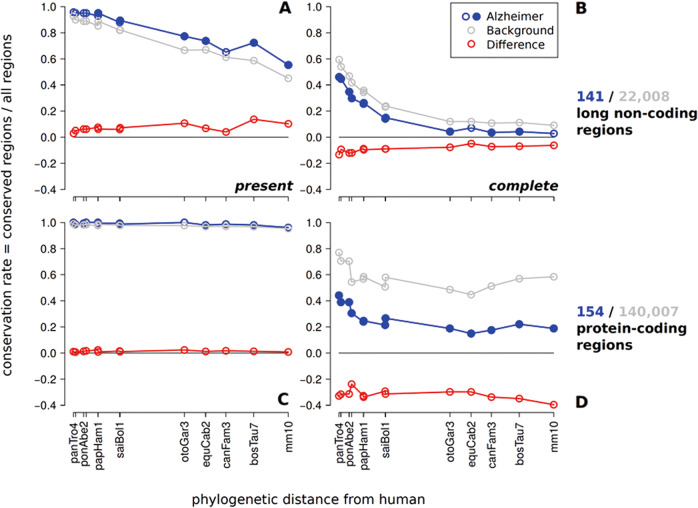
Fig. 2.
Conservation rates of human AD-associated non-protein-coding (a, b) and protein-coding (c, d) regions comparing present and completely conserved gene structure. On the horizontal axis mammalian species are indicated (denoted by the UCSC abbreviations) at their phylogenetic distance from human. Distinct data points are connected by lines to guide the eye. Variations in assembly and alignment quality cause some non-monotonicity in the curves, the overall decrease of conservation with phylogenetic distance is nevertheless clearly visible. Statistical significance of differences is computed independently for each species. Filled circles indicate p < 0.05. The fraction of detectable conserved AD-associated non-coding transcripts (141) is marginally higher than the conservation of the background set non-coding transcripts (22,008) if only presence/absence of a transcript is considered (A/C). In contrast, if conservation of the entire gene structure is considered (B/D), AD-associated genes are significantly less conserved than the control. This is true for both lncRNAs (b) and protein-coding genes (d, 154 AD-associated, 140,007 control). We also show intermediate levels of gene structure conservation in the Supplementary Figs. S2, S3. Additional controls against possible confounding effects e.g. of alignment quality in Supplementary Figs. S4, S5 demonstrate that the trends found here are robust.

