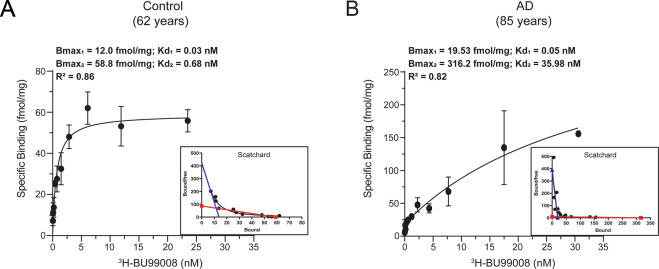
Fig. 1. 3H-BU99008 saturation binding assay.
3H-BU99008 saturation binding studies were performed in temporal cortex brain tissue homogenates from one CN and one patient with AD using increasing concentrations of 3H-BU99008 (0–35 nM). A and B show the saturation binding curves for the CN (62 years) and Alzheimer’s disease (85 years) cases, respectively, along with the corresponding Scatchard plots. For the CN, the second binding site was drawn manually after fitting the data using the Hill slope-specific binding function in GraphPad Prism 8.3 software (A; blue dotted line). Data are presented as means ± SEM of two experiments in triplicate. Kd- dissociation constant; Bmax- density of binding sites.

