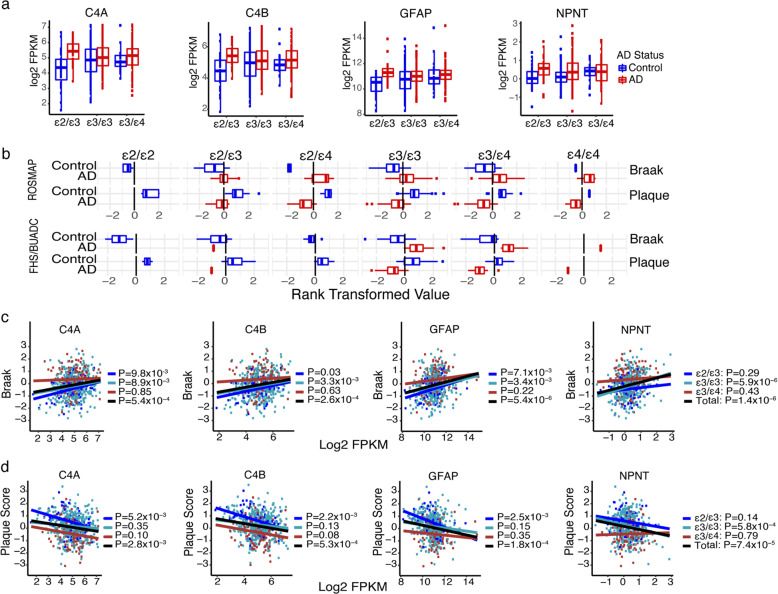
Fig. 1. Differentially expressed genes (DEGs) among APOE ε2/ε3 individuals and in the total sample.
a Boxplots showing distribution of gene expression level (represented as log2 FPKM) by AD status and APOE genotype for top-ranked DEGs among APOE ε2/ε3 subjects in the ROSMAP dataset. b Boxplots showing the distribution of rank-transformed plaque score and Braak stage by APOE genotype and AD status among subjects in the ROSMAP and FHS/BUADC datasets. c, d Scatterplots showing the correlation of expression of the top-ranked DEGs among APOE ε2/ε3 subjects with rank-transformed Braak stage (c) and plaque score (d) in the ROSMAP dataset according to APOE genotype depicted by color (ε2/ε3 = dark blue, ε3/ε3 = light blue, ε3/ε4 = red, total = black). Coordinates for expression (quantified as log2 FPKM) plotted against plaque or Braak score for each subject are shown as dots and their correlation across subjects is represented by fitted solid lines.

