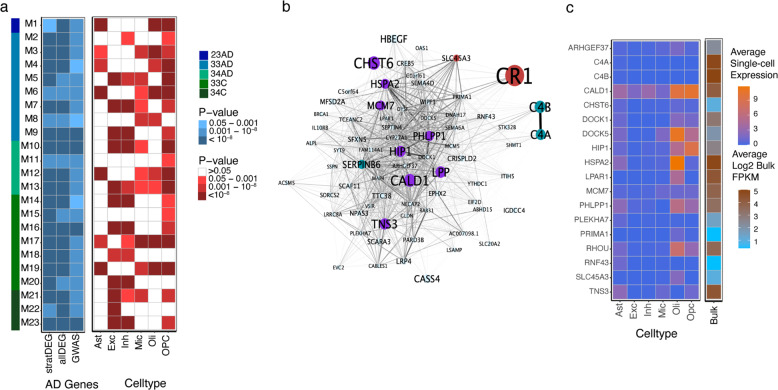
Fig. 2. AD-related gene co-expression networks in brain.
a Heatmaps depicting association of co-expressed gene networks (modules M1–M23) derived from analysis within a subgroup defined by APOE genotype and AD status according to the color scheme shown on the right. The far-left vertical bar, the left blue-shaded panel, and the right red-shaded panel represents networks enriched in different APOE genotype subgroups, in differentially expressed genes between AD and control subjects, and in particular cell types, respectively. The AD gene heatmap showed enrichment of each gene co-expression network with genes that are differentially expressed in (1) the corresponding APOE genotype subgroup (stratDEG) or (2) the entire sample (allDEG), or with AD risk genes established by GWAS. The cell-type heatmap shows enrichment of each gene co-expression network for astrocytes (Ast), excitatory neurons (Exc), inhibitory neurons (Inh), microglia (Mic), oligodendrocytes (Oli), and oligodendrocyte progenitor cells (OPC). All enrichment p values are Bonferroni corrected. b Gene co-expression network (M01) that was derived using WGCNA from analysis of APOE ε2/ε3 subjects with AD. Differentially expressed genes in the APOE ε2/ε3 genotype group (p < 0.01) and in the total sample (p < 10−6) are highlighted in turquoise. Genes associated with AD risk in GWAS (p < 10−3) and differentially expressed in the total sample (p < 10−6) are highlighted in purple. Genes associated with AD risk at the genome-wide significance level and differentially expressed in the total sample (p < 10−6) as well as in the APOE ε2/ε3 genotype group (p < 0.01) are highlighted in red. The size of each node inversely corresponds with the p value supporting the association of the gene with AD. c Heatmaps showing the average expression of genes in ROSMAP subjects across cell-types calculated from analysis of single-nuclei RNA-seq data and in the bulk RNA-seq data from subjects overlapping the single-cell RNA-seq dataset. Genes are members of the M01 co-expression network whose expression was nominally associated (p < 0.05) with plaque score and Braak stage. C5orf64 was excluded as it did not occur in the single-cell expression dataset.

