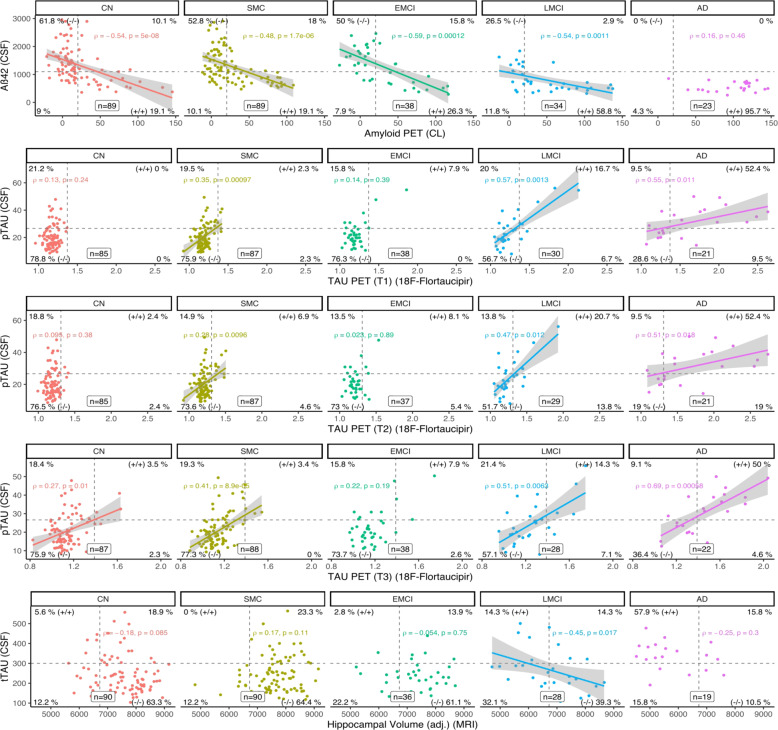
Fig. 2. Correlations between CSF and imaging (PET and MRI) biomarkers across diagnostic groups.
A = PET amyloid-β 18F-florbetapir PET and 18F-florbetaben levels; AD = Alzheimer’s disease; CN = cognitively normal; EMCI = early MCI; LMCI = late MCI; MCI = mild cognitive impairment; ROI = region of interest; SMC = subjective memory concern; T = PET tau 18F-flortaucipir level; T1 = T measured in the temporal meta-ROI; T2 = T measured in the inferior temporal cortex ROI; T3 = T measured in the entorhinal cortex ROI; N1 = neurodegeneration measured as hippocampal volume adjusted for intracranial volume.

