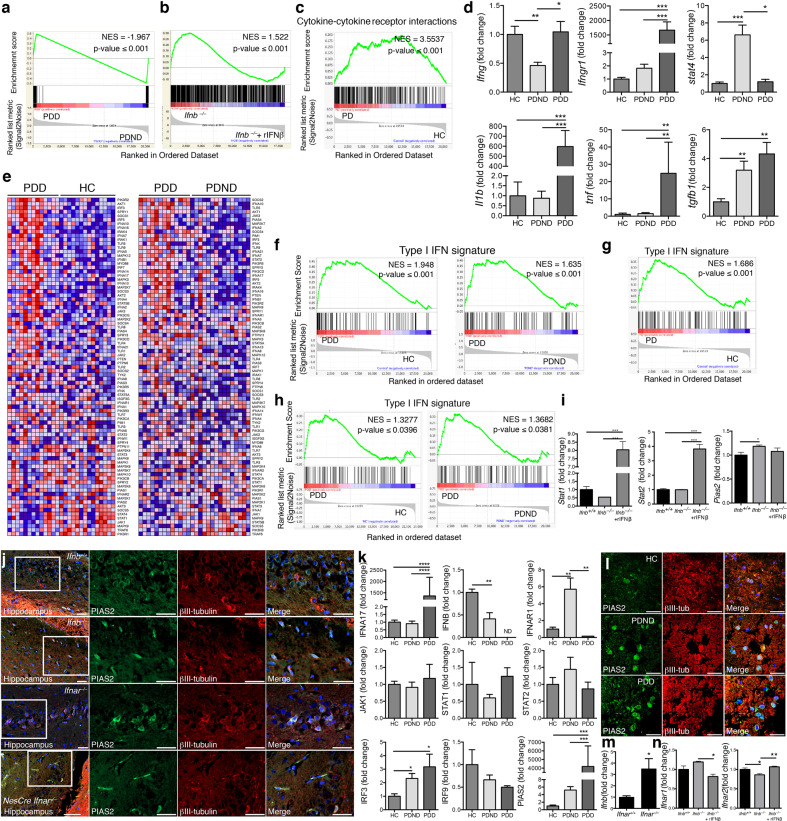
Fig. 1. Upregulation of neuronal PIAS2, a negative regulator of IFNβ-IFNAR signaling, in the brains of sporadic PD patients.
a GSEA class prediction analysis distinguishing sporadic Parkinson disease patients with dementia (sPDD; n = 13) from sPD patients with nondementia (sPDND; n = 15), used as the discovery cohort. b Core enriched gene signature (638 genes) of sPDD versus sPDND patients used as a class predictor of Ifnb–/– neurons with and without rIFN-β treatment (100 U/ml for 24 h). c Enrichment plot of “cytokine–cytokine receptor interaction” pathway comparing microarrays from substantia nigra of PD patients (n = 45) and HCs (n = 25) pooled from three independent studies (GSE7621, GSE20141, and GSE49036) and used collectively as the discovery cohort. d RT-qPCR of medial frontal gyrus of HC, sPDND, and sPDD patients (n = 3–10 patients from in-house validation cohort). Graphs represent mean ± SEM and *P < 0.05; **P < 0.01; ***P < 0.001 by one-way ANOVA and Turkey’s post hoc correction test. e Heatmaps from GSEA of the type I IFN signature and comparing microarray data from sporadic Parkinson disease with dementia (sPDD; n = 13), sPD with no dementia (PDND; n = 15), and healthy controls (HC; n = 14). f Enrichment plots of e. g, h Enrichment plots of the type I IFN signature g comparing PDD with HC from the pooled cohorts GSE7621, GSE20141, and GSE49036. h Comparing PDD with PDND and HC from GSE49036. For all plots, NES: normalized enrichment score. i Fold-change in Stat1, Stat2, and Pias2 expression from microarray comparing Ifnb–/– and Ifnb+/+ CGNs with or without rIFN-β (GSE63815). Graphs represent mean ± SEM of n = 3/group; *P < 0.05 and ***P < 0.001 by one-way ANOVA. j IF staining for PIAS2 (green), βIII-tubulin (red); and DAPI (blue) in hippocampus of WT, Ifnb–/–, Ifnar1–/–, and nesCre:Ifnar1fl/fl mice. Bar, 50 μm. k RT-qPCR of selected genes from medial frontal gyrus regions of HC, sPDD, and sPDND. Graphs represent mean ± SEM, n = 3–10/group. *P < 0.05, **P < 0.01, ***P < 0.001, and ****P < 0.0001 by one-way ANOVA and Turkey’s post hoc correction test. l IF staining for PIAS2 (green), βIII-tubulin (red), and DAPI (blue) in the frontal cortex region of HC, sPDD, and sPDND patients. Bar, 50 μm. m RT-qPCR of Ifnb from brain of 3-month-old Ifnar1–/– and Ifnar+/+ mice. Graphs represent mean fold-change ± SEM (n = 3). *P < 0.05 by Student’s t-test. n Expression of Ifnar1 and −2 from microarrays of Ifnb–/– and Ifnb+/+ CGNs with or without rIFN-β (GSE63815). Graphs represent mean ± SEM of n = 3/group and *P < 0.05, **P < 0.01 by one-way ANOVA.

