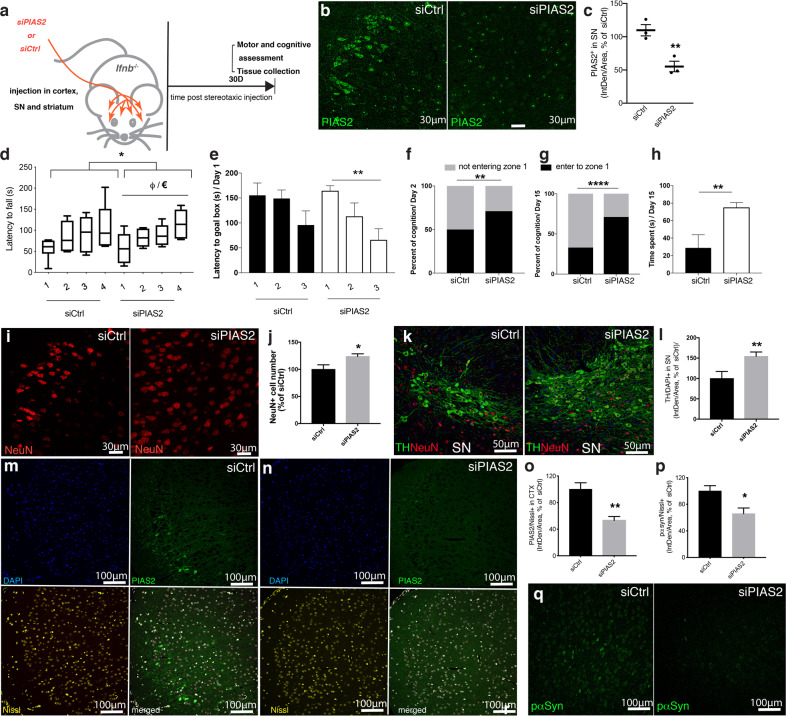
Fig. 5. Brain-specific knockdown of PIAS2 reverses the neurodegenerative process and prevents motor and cognitive impairments in Ifnb–/– mice.
a Schematic of experiment showing injection sites of siRNA knockdown of PIAS2 (siPIAS2) or control (siCtrl) by in vivo stereotactic injection in the frontal cortex and nigrostriatal regions in Ifnb–/– brains and behavioral testing days. b, c Assessment of knockdown efficiency by IF. b IF of PIAS2 (green) in the SN and c quantification in Nissl+ neurons in the SN. **P < 0.01 by two-tailed unpaired Student’s t-test. n = 3/group. d Rotarod motor coordination test ± SEM; *P < 0.05 by two-way ANOVA comparing siCtrl- and siPIAS2-treated groups (n = 6–7) and €P < 0.05 by repeated measure one-way ANOVA in siPIAS2-treated Ifnb–/– mice. One-way ANOVA showing φP < 0.05 by paired t-test between the 1st and 4th trials in siPIAS2-treated Ifnb–/– mice. e–h Barnes maze test. e Data latency to goal box in seconds ± SEM. **P < 0.01 by two-tailed paired t-test in siPIAS2-treated group indicating improvement from the 1st to 3rd trial (n = 6–7). f, g Data are percentage of cognition (entering zone 1 or not) during probe days 2 and 15 post training day 1. **P < 0.01 and ****P < 0.0001 by two-tailed unpaired t-test between siPIAS2- and siCtrl-treated Ifnb–/– groups (n = 6–7). h Cumulative time spent in zone 1. Data ± SEM; *P < 0.05 by two-tailed Mann–Whitney test between siPIAS2- and siCtrl-treated Ifnb–/– groups (n = 6–7). i–o IF of PIAS2 (green) alone or co-stained with Nissl, NeuN, and DAPI (blue) and TH co-stained with NeuN in siPIAS2- vs. siCtrl-treated groups. i IF of NeuN and j quantification of NeuN+ neurons in the CTX. Graph represents intensity of positive staining/area of siPIAS2 normalized to siCtrl. *P < 0.05 using two-tailed unpaired Student’s t-test. n = 10/group. k IF of TH (green), NeuN (red), and DAPI staining in SN. l IF quantification of TH+DAPI+ neurons. Graph represents intensity of double-positive cells in siPIAS2 normalized to siCtrl. **P < 0.01 by unpaired Student’s t-test; n = 8–9/group. m, n IF of PIAS2 (green) and Nissl (yellow) in CTX of siPIAS2 brains normalized to siCtrl group. o Quantification of PIAS2 in CTX. **P < 0.01 by two-tailed unpaired Student’s t-test. n = 4/group. p, q IF of pα-syn (green) in SN and quantification in Nissl+ neurons. *P < 0.05 by two-tailed unpaired Student’s t-test. n = 3/group.

