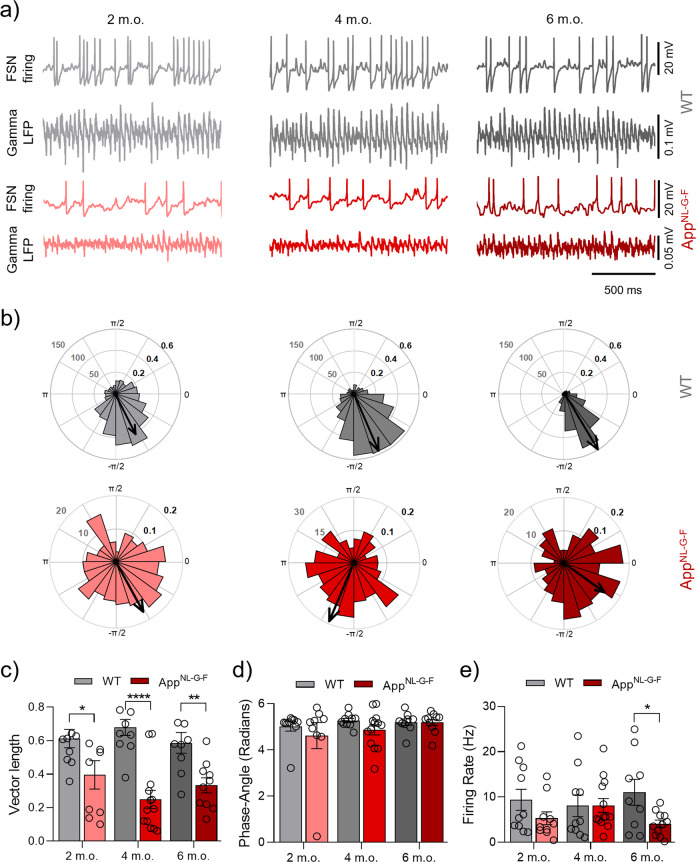
Fig. 4. Impaired FSN spike-gamma coupling in AppNL-G-F mice appears at 2 m.o. (KA present).
a Representative traces from concomitant recordings of FSN firing and LFP gamma oscillations at 2 m.o., 4 m.o. and 6 m.o. from WT (gray) and AppNL-G-F (red). b Representative polar plots of a representative FSN AP-phase angle at 2 m.o., 4 m.o. and 6 m.o. from WT (gray) and AppNL-G-F (red). c Summary of FSN vector length data at 2 m.o. (WT n:10 (N = 7) vs AppNL-G-F n:10 (N = 7), p = 0.0088), 4 m.o. (WT n:10 (N = 7) vs AppNL-G-F n:13 (N = 7), p < 0.0001) and 6 m.o. (WT n:9 (N = 6) vs AppNL-G-F n:10 (N = 7), p = 0.0082) for WT (gray bars) and AppNL-G-F (red bars). d Summary of FSN phase angle data at 2 m.o. (p = 0.4241), 4 m.o. (p = 0.4472) and 6 m.o. (p = 0.9844) for WT (gray bars) and AppNL-G-F (red bars). e Summary of FSN firing rate data at 2 m.o. (p = 0.2775), 4 m.o. (p = 0.9762) and 6 m.o. (p = 0.0479) for WT (gray bars) and AppNL-G-F (red bars). “n” indicates the number of cells. “N” indicates the number of mice. Data in bar graphs are presented as mean ± SEM. Statistics from two-way ANOVA followed by a Holm–Sidak’s multiple comparisons test (Supplementary Table 1). *p < 0.05, **p < 0.01, ****p < 0.0001.

