Figure 4.
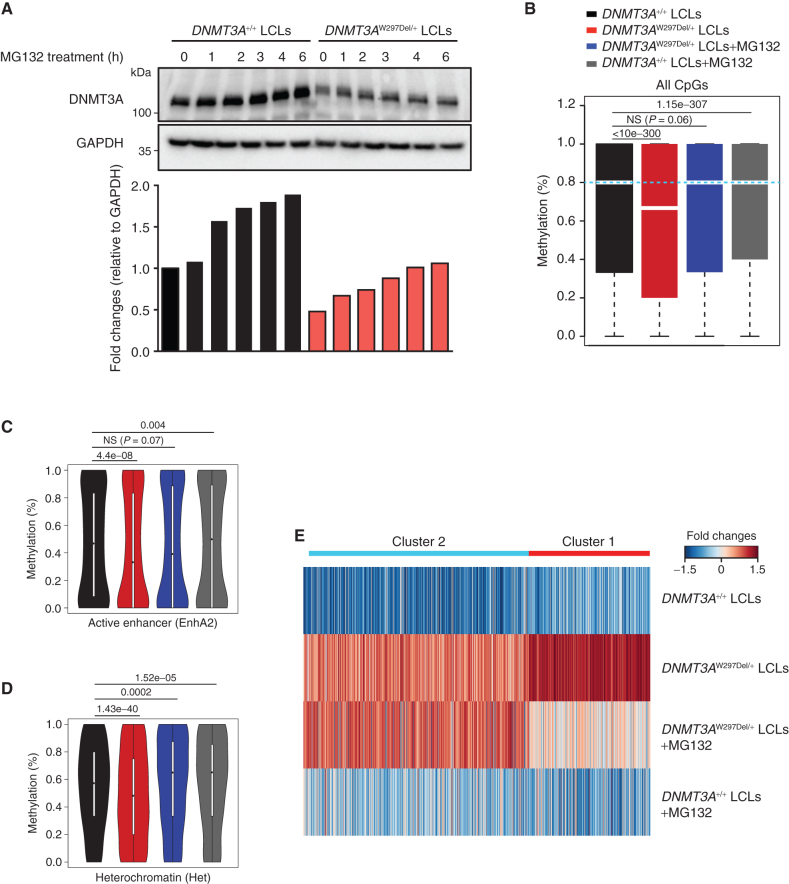
Proteasome inhibitors partially restore the methylome and transcriptome in patient-derived cells. A, Western blotting and fold-change quantification of DNMT3A and GAPDH protein expression in LCL cells from WT or a patient with TBRS (W297del). DNMT3A was normalized to GAPDH. B, Box plots showing DNA methylation distribution analyzed by whole-genome bisulfite sequencing in the indicated LCL cells with and without proteasome inhibition through MG132 treatment. The bars represent methylation ratios between the first and third quartiles, with the median distribution, shown by a gap in the bars, of 66.7% (DNMT3AW297Del/+) and 80% (all other samples). The whiskers represent methylation in the first and fourth quartiles. The statistical values represent the Wilcox rank-sum test. C, Violin plots of DNA methylation distribution in 12,896 active enhancer regions as defined in the Roadmap Epigenomic Project. D, Violin plot of DNA methylation ratios in 10,973 heterochromatic regions as defined in the Roadmap Epigenomic Project. E, Gene expression heat map of the indicated cells and treatments. Cluster 1 genes were hypomethylated in DNMT3AW297Del/+ compared with WT LCLs and responsive to proteasome inhibitors. Cluster 2 genes were hypomethylated in DNMT3AW297Del/+ compared with WT LCLs but inert to proteasome inhibitors. See also Supplementary Fig. S8.

