
Fig. 1. Molecular signatures of Alzheimer’s Disease (AD) in (A) ε4-negative and (B) ε2-negative samples.
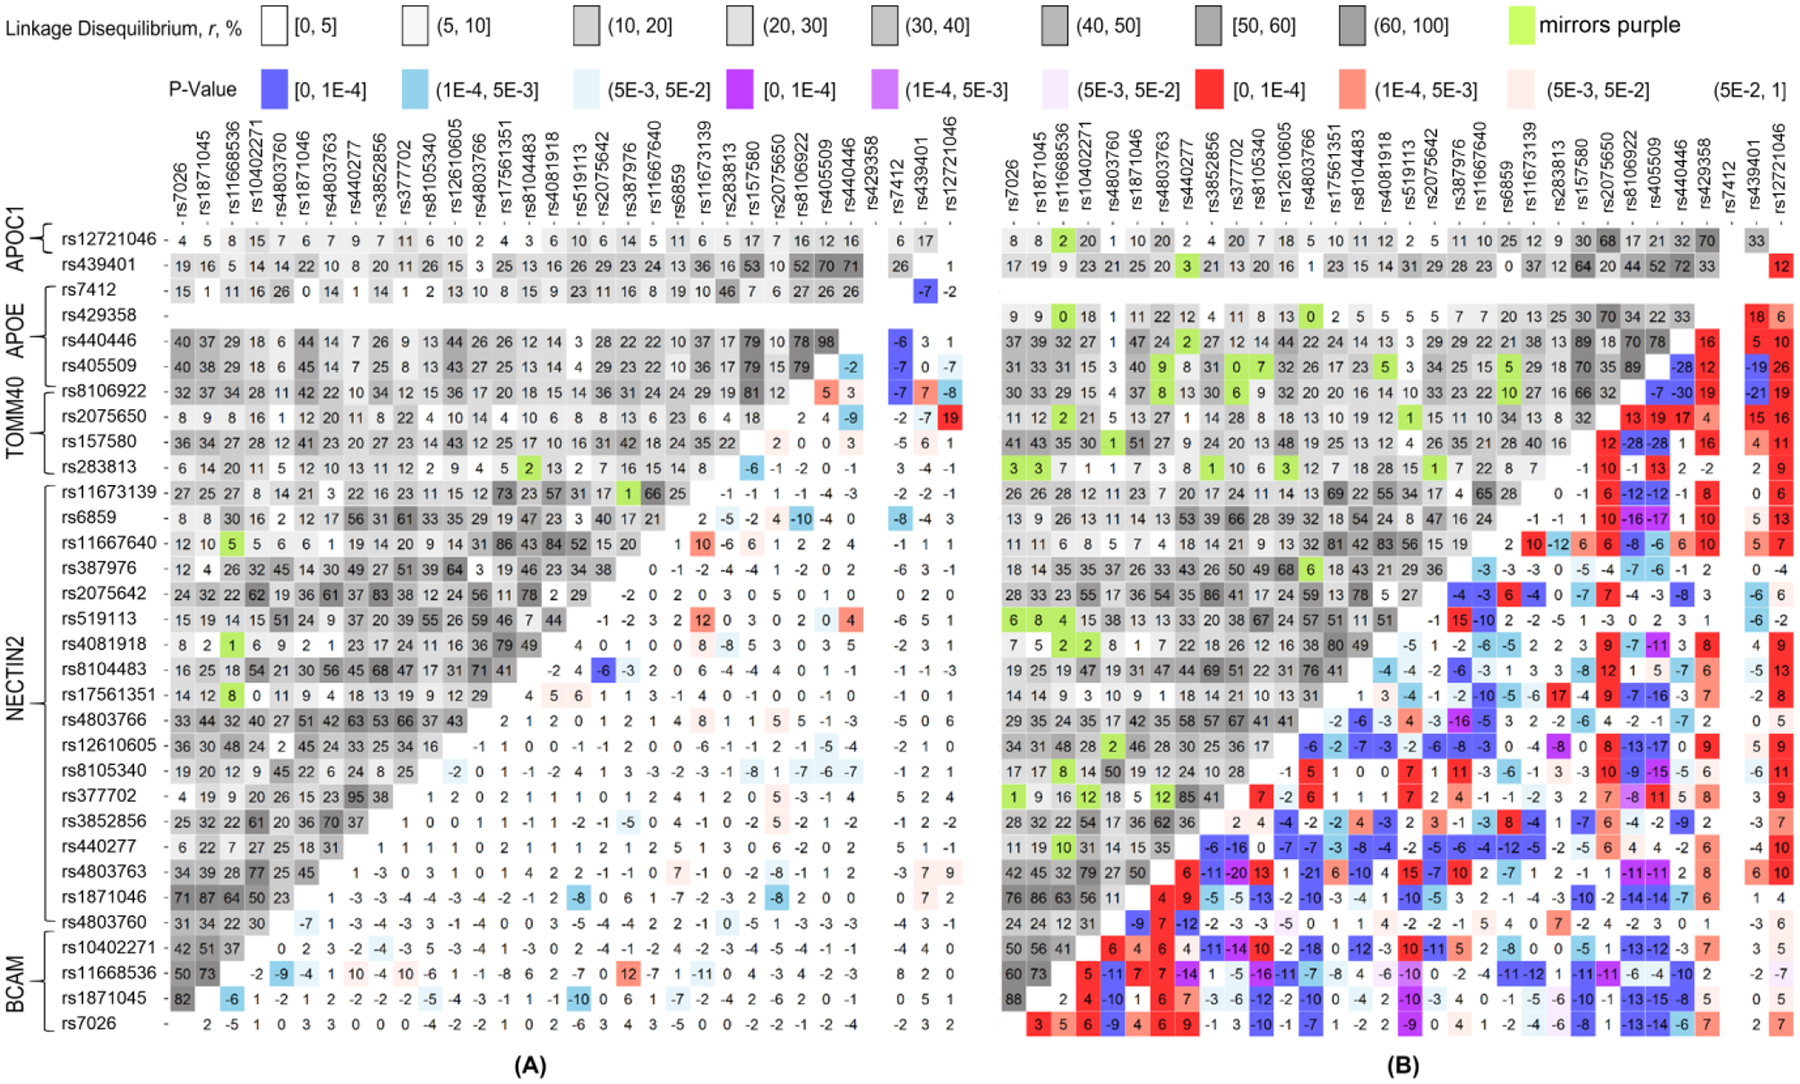
Upper-left triangle: Linkage disequilibrium (LD) pattern (r, %) in the pooled sample, non-cases. Lower-right triangle: heat map for Δr=rcases–rnon-cases representing the molecular signature of AD. Red denotes rcases>rnon-cases and blue denotes rcases<rnon-cases. Purple and green show the estimates with opposite signs of rcases and rnon-cases. For convenience, positive sign of rnon-cases has been selected. The legend on the top shows color-coded p-values and grey-coded LD. Numerical estimates are given in Supplemental Table S3.