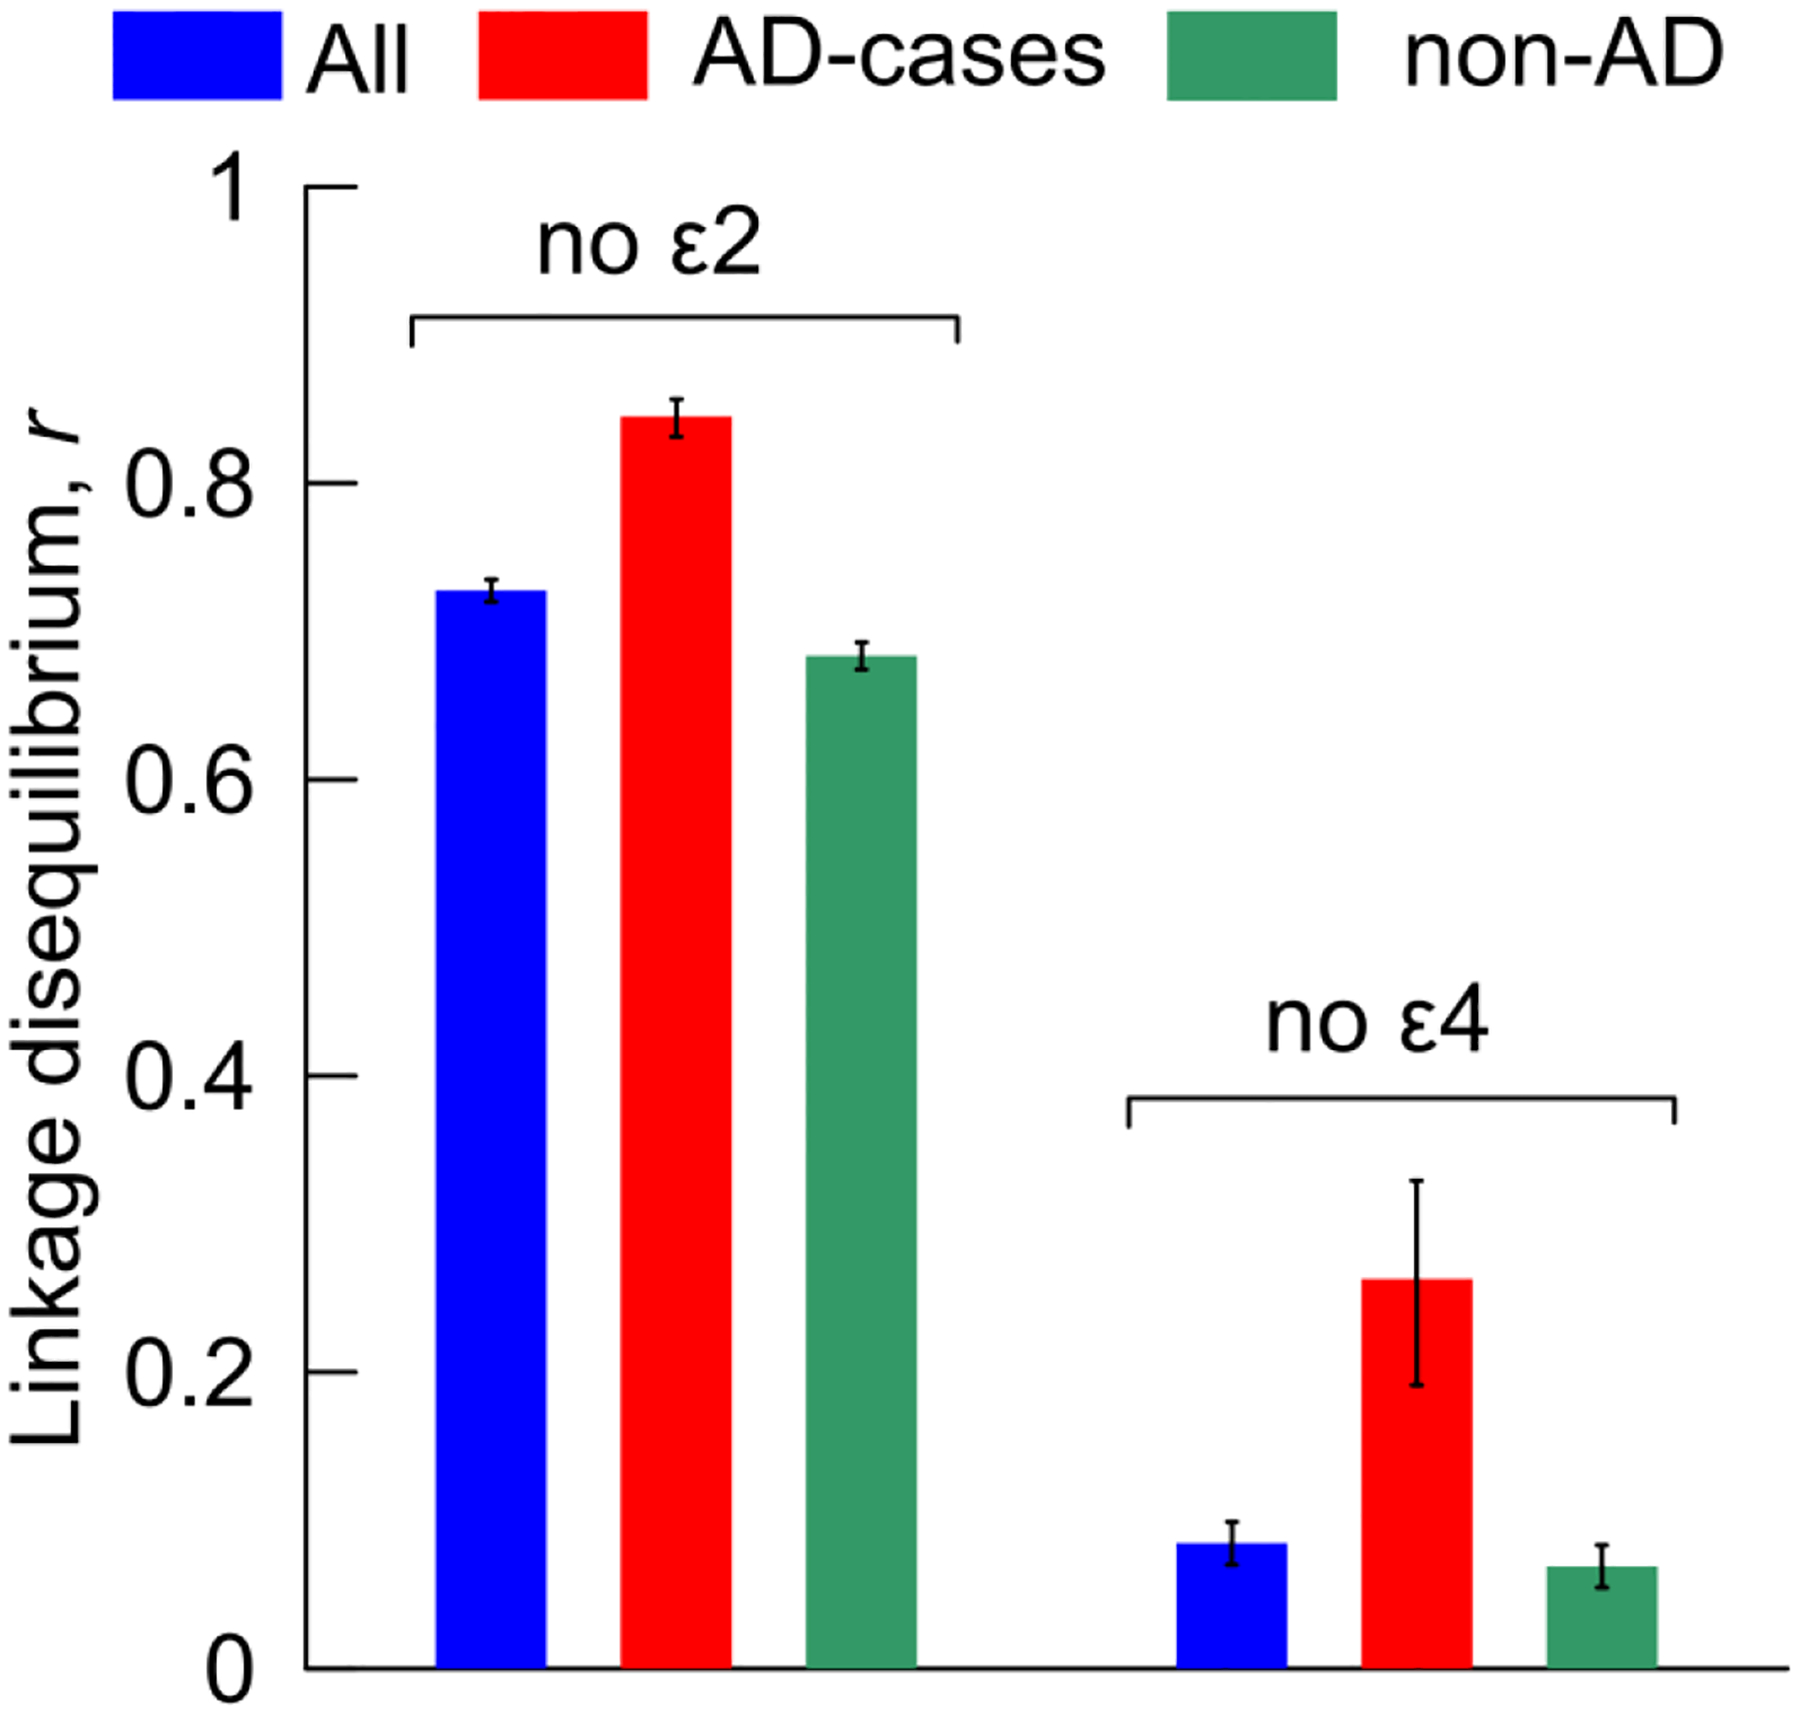
Fig. 2. Linkage disequilibrium (r) between rs2075650 (TOMM40) and rs12721046 (APOC1) in the ε2- and ε4-negative samples.

Blue, red, and green denote pooled samples from all studies of (all) AD-cases and non-cases combined, AD-cases, and (non-AD) AD-non-cases, respectively. Vertical lines show standard errors. Numerical estimates are given in Supplemental Table S3.
