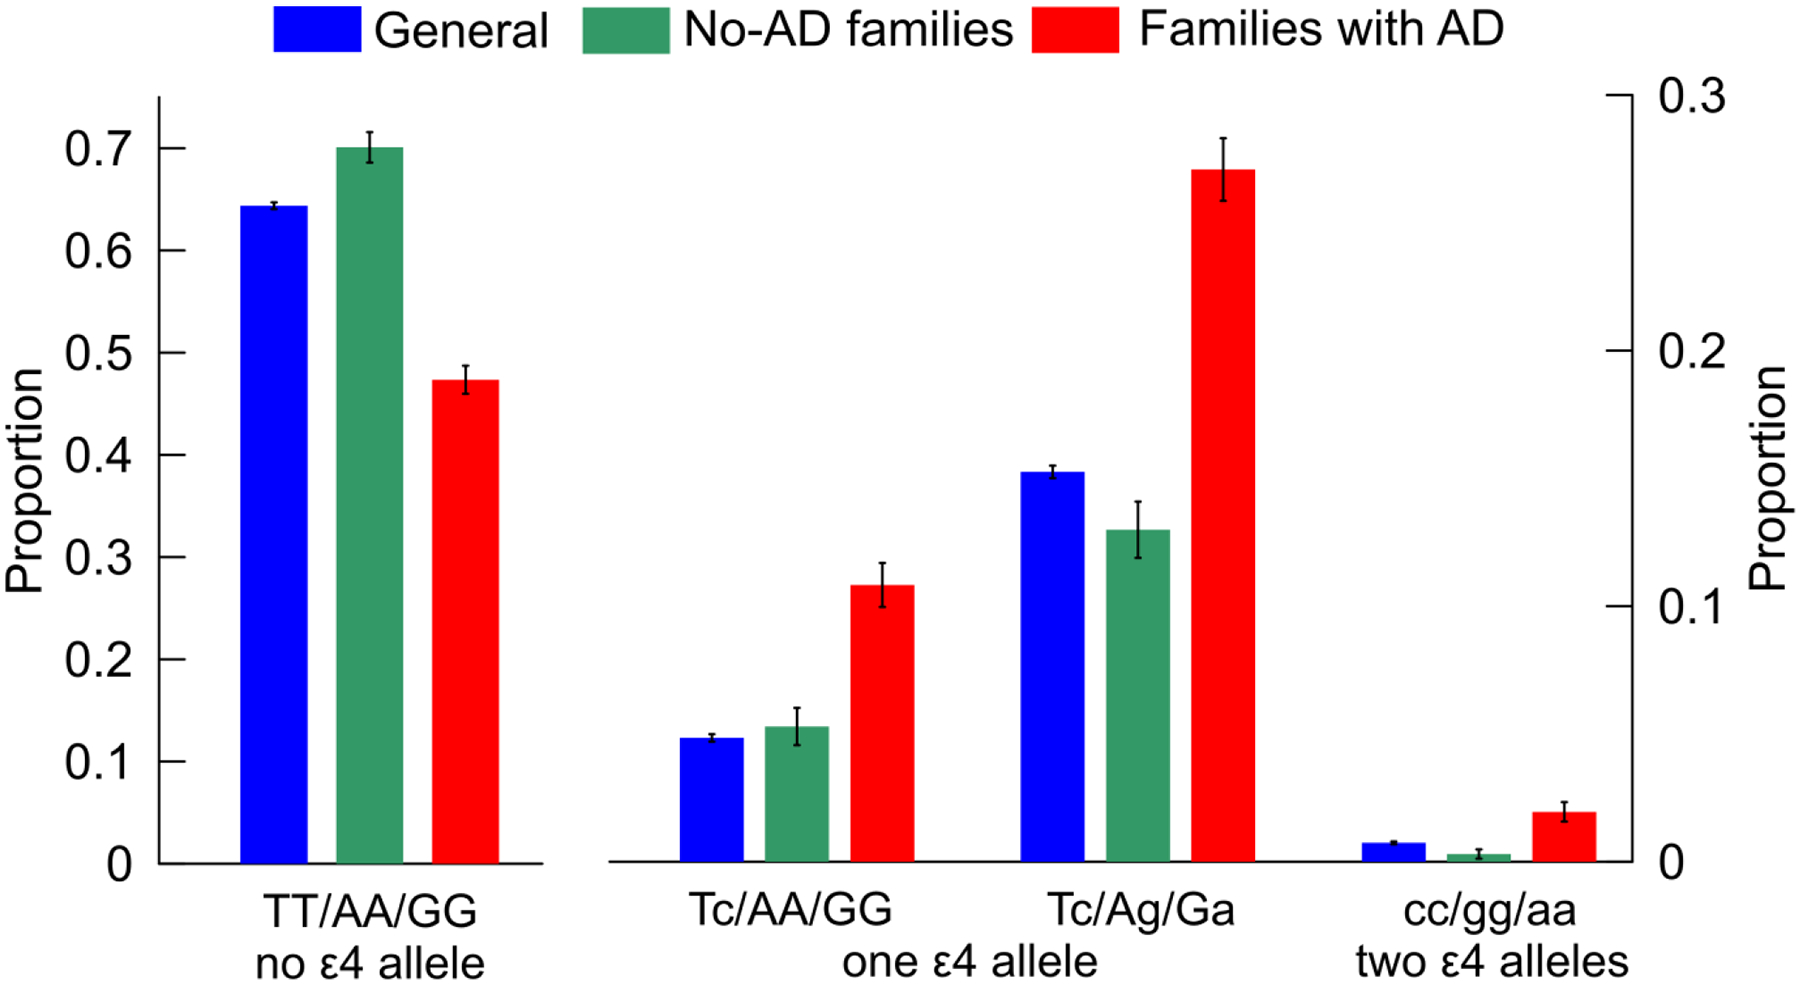
Fig. 3. Proportions of the beneficial (A) and adverse (B and C) compound genotypes in the Alzheimer’s disease (AD) unaffected subjects.

The labels on the x-axis show compound genotypes constructed from SNPs ordered as rs429358, rs2075650, or rs12721046 comprising samples with: (A) no ε4 allele, (B) one copy of ε4 allele, and (C) two copies of ε4 allele. Blue (“general”): the pooled sample of LOADFS, HRS, FHS, and CHS (data are in Supplemental Table S5, non-cases). Samples from the LOADFS from families: (green, “no-AD families”) without a history of AD and (red, “families with AD”) with history of AD (data are in Supplemental Table S8). Vertical lines show standard errors.
