
Fig. 4. Odds ratios (ORs) for Alzheimer’s disease (AD) for selected compound genotypes.
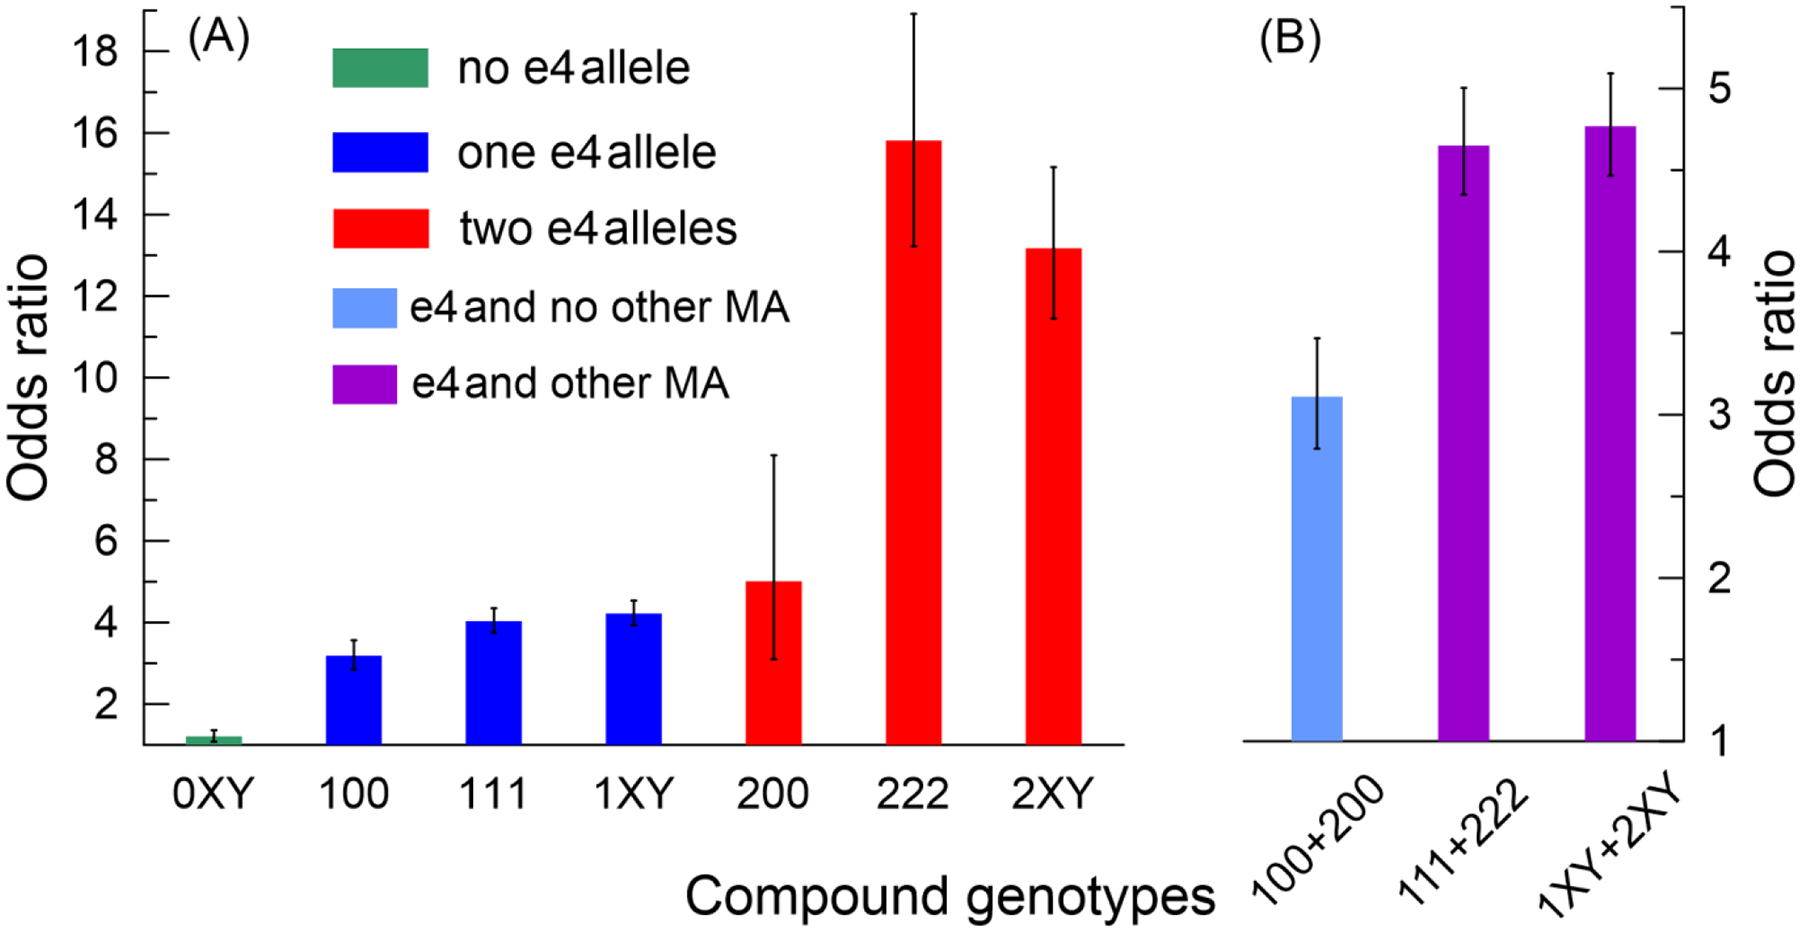
(A) green, blue, and red denote ORs in samples with no, one, and two copies of the ε4 allele, respectively. (B) ORs for the ε4 allele carriers who do not carry (light blue) and carry (purple) minor alleles (MAs) of rs2075650 and rs12721046 SNPs. Numbers in the labels on the x-axes show the number of MAs for SNPs ordered as rs429358, rs2075650, or rs12721046. Symbols “X” and “Y” denote aggregated compound genotypes; these symbols take values of 0, 1, or 2 but not simultaneously 0. Bars show the estimates of ORs from the models with the major allele homozygous genotype (TT/AA/GG) as a reference. Numerical estimates for ORs for: (i) 100, 111, 200, and 222 are in Supplemental Table S9, (ii) 0XY, 1XY, and 2XY are in Supplemental Table S10, and (iii) 100+200, 111+222, and 1XY+2XY are in Supplemental Table S11. Vertical lines show standard errors.