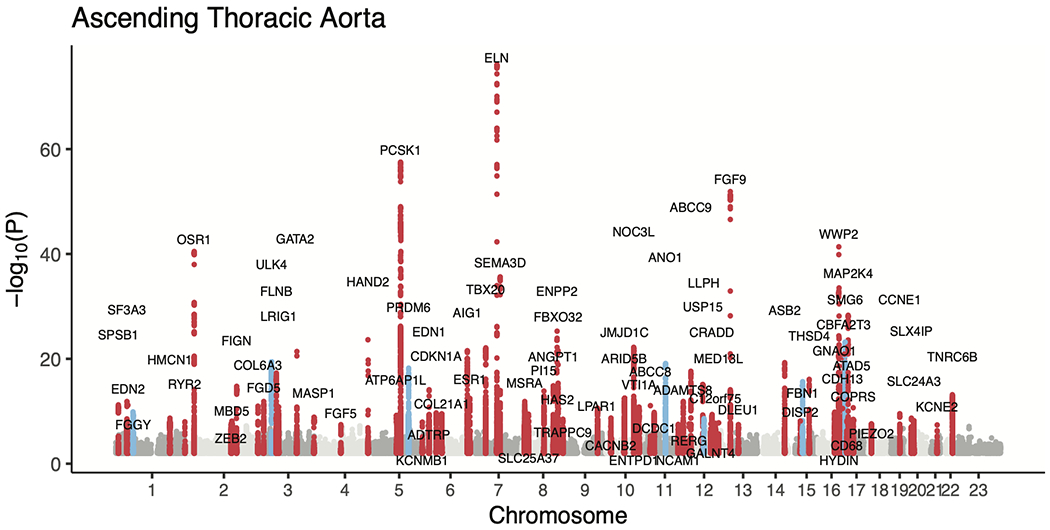
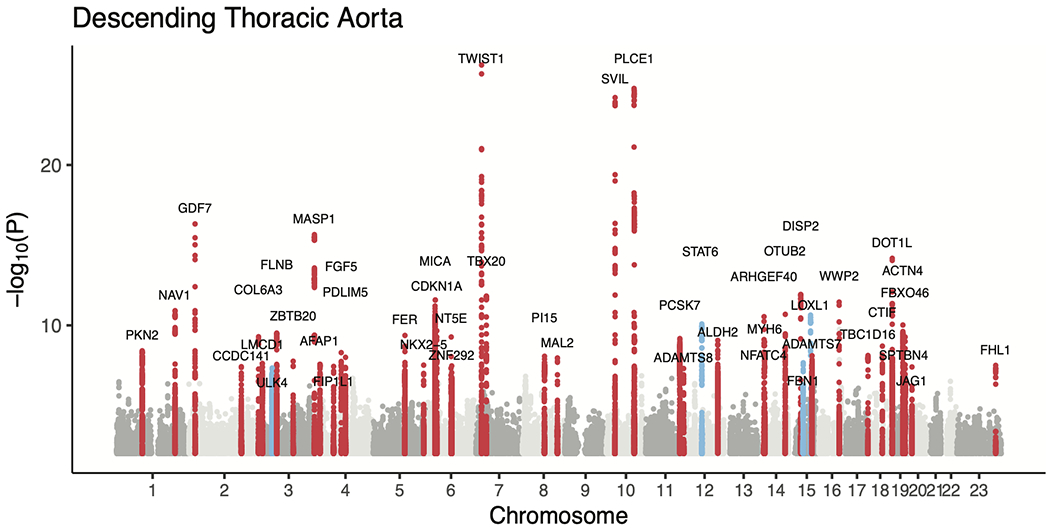
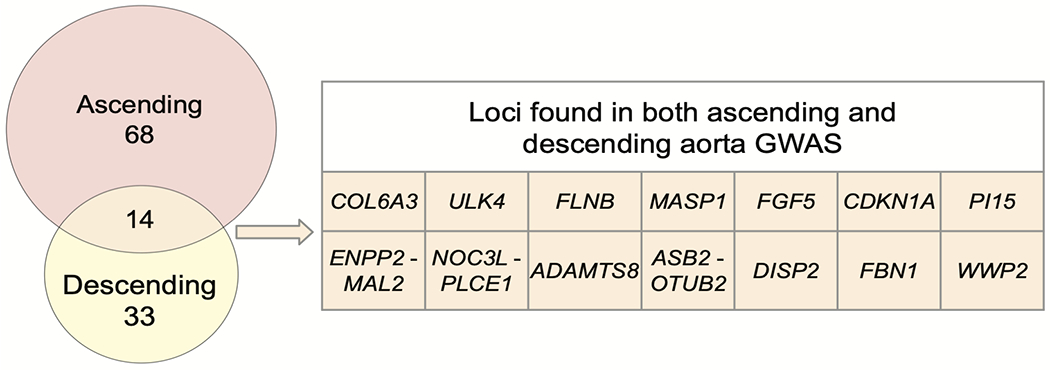
Figure 2 |. Genome-wide association study results for ascending and descending thoracic aorta diameter.


a,b, Loci with P < 5 × 10⁻⁸ are shown in red (if not previously reported) or blue (if previously reported in common variant association studies for aortic size or disease status (aneurysm or dissection)). The X chromosome is represented as ‘23’. c, Venn diagram showing the number of loci uniquely associated at P < 5 × 10⁻⁸ with either the ascending or descending thoracic aorta. Those in orange are associated with both and are enumerated in the table to the right. Loci whose lead SNP’s nearest gene differs between ascending and descending are demarcated as “Ascending/Descending”.
