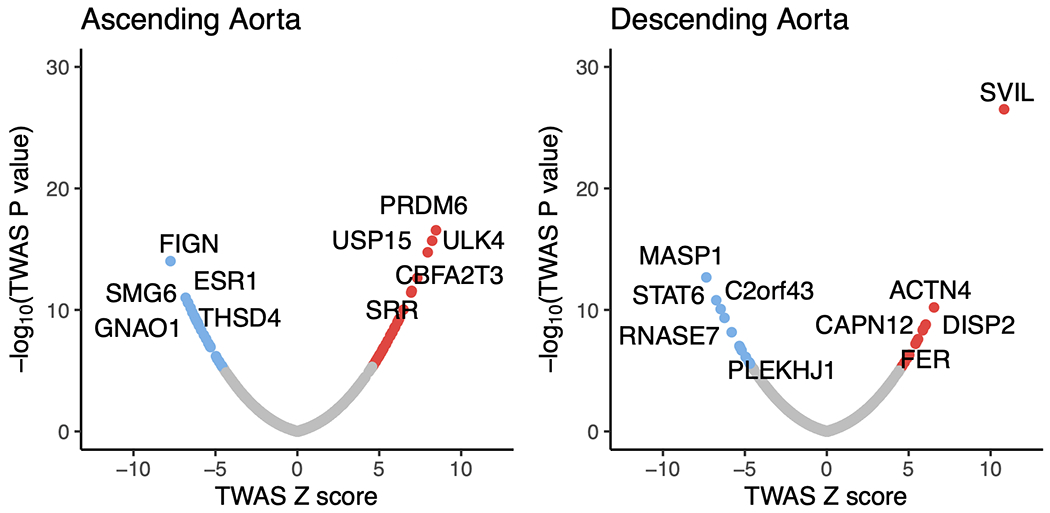
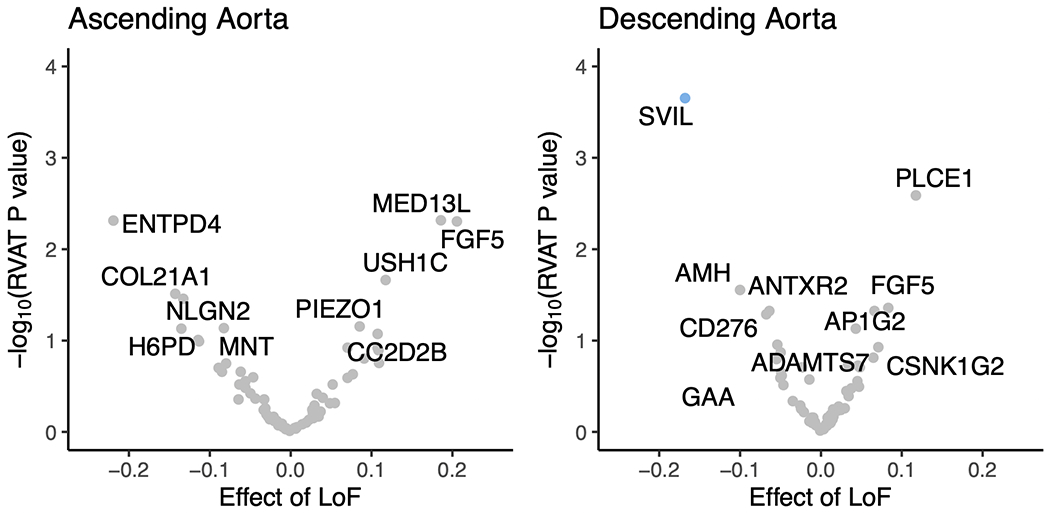
Figure 3 |. Gene-level association tests.


In the top row, protein-coding genes associated with the size of the ascending (left) and descending (right) thoracic aorta based on an integrated gene expression prediction are shown. The x-axis represents the magnitude of the TWAS Z score, while the y-axis represents the −log10 of the TWAS P value. Genes achieving Bonferroni significance are colored red (positive correlation) or blue (negative correlation). The top five positively and negatively correlated genes are labeled. In the bottom row, rare variant collapsing burden test results are depicted for the genes within a 500-kb window around GWAS loci (67 for ascending and 55 for descending). Loss-of-function carrier status in each gene was tested for association with the size of the ascending (left) and descending (right) thoracic aorta. The x-axis represents the effect size of LoF in each gene on aortic size, while the y-axis represents the −log10 of the association P value in a logistic model. SVIL, which achieved P < 0.05/55 in the descending aorta, is colored blue. The top five positively and negatively correlated genes are labeled.
