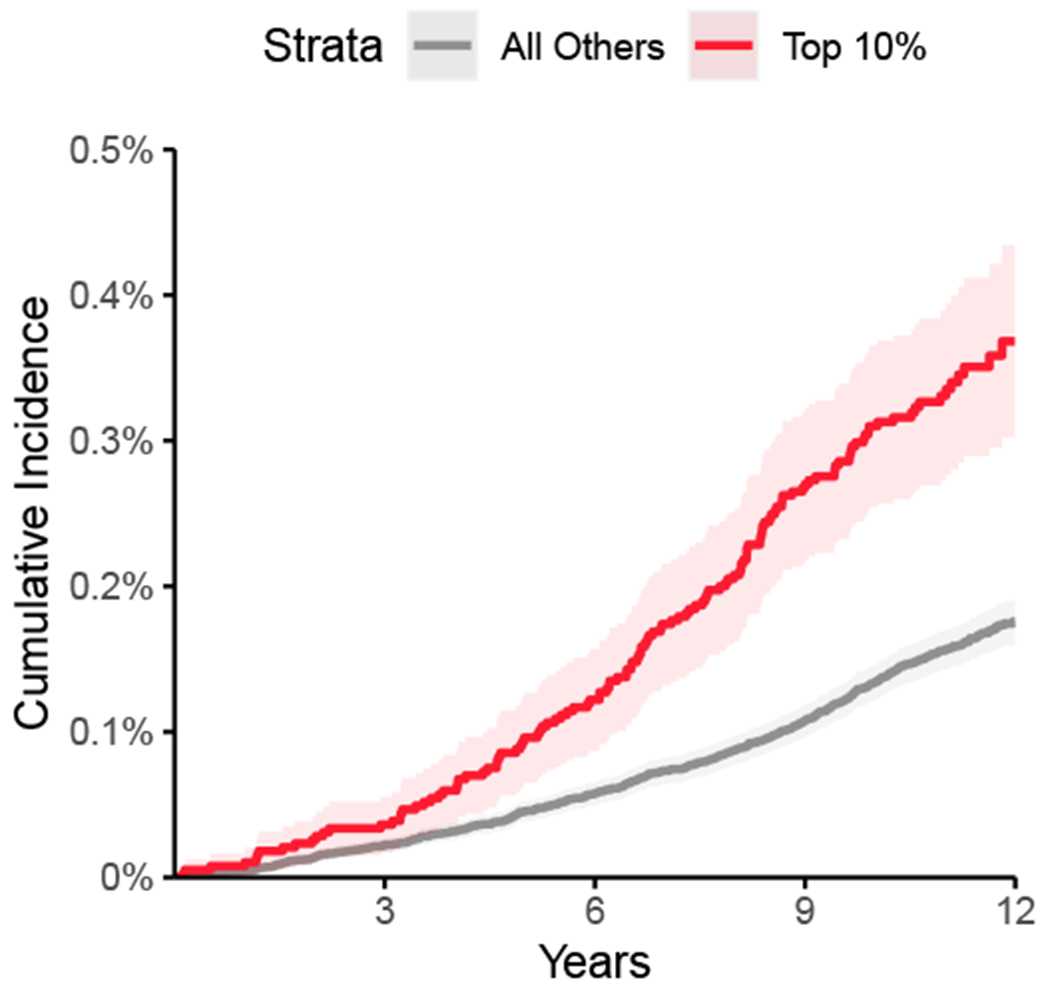
Figure 5 |. Cumulative incidence of thoracic aortic aneurysm or dissection stratified by polygenic score.

The cumulative incidence (1 minus the Kaplan-Meier survival estimate) of a diagnosis of aortic aneurysm or dissection (y-axis) is plotted against the number of years since UK Biobank enrollment (x-axis). Individuals in the top tenth percentile of the polygenic score for ascending aorta size are shown in red; the remaining 90% are shown in gray. The 95% confidence intervals (from the cumulative hazard standard error) are represented with lighter colors.
