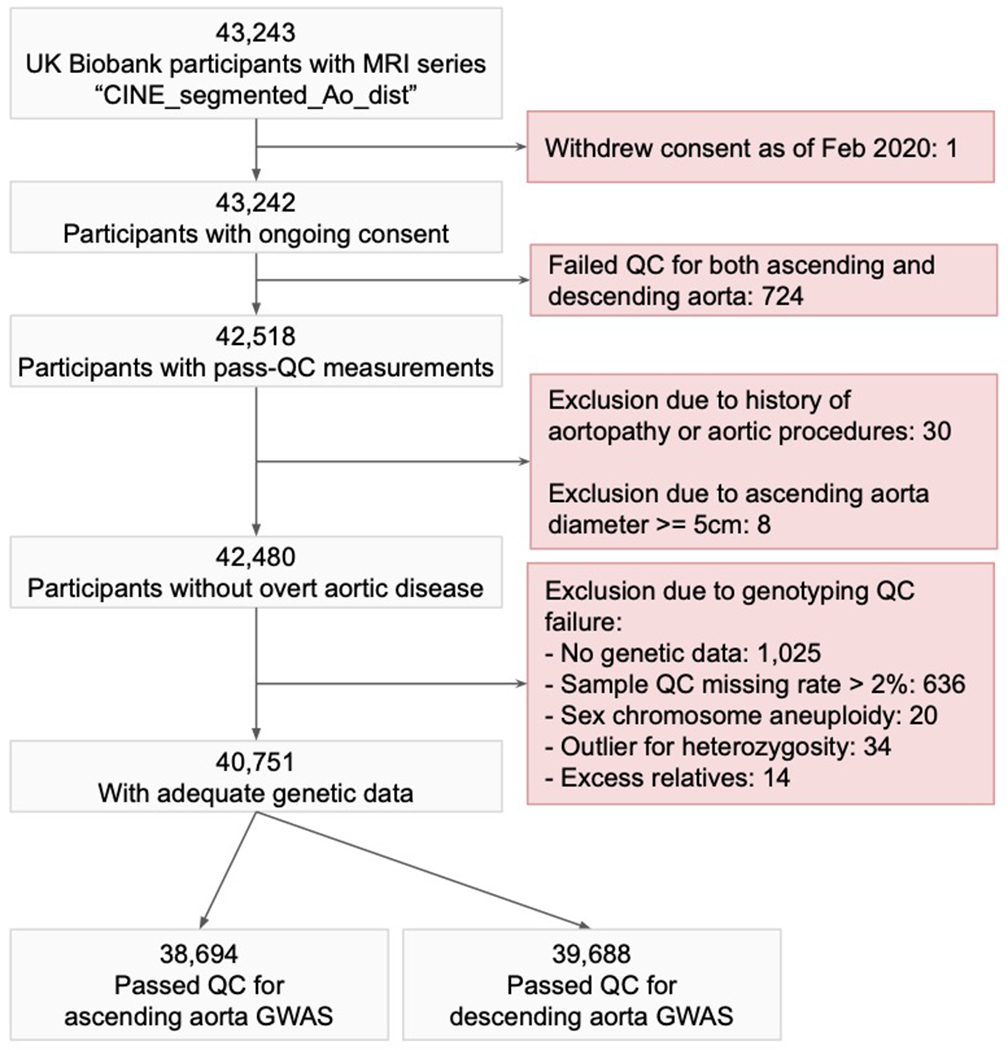
Extended Data Fig. 2. GWAS sample flow diagram.

The GWAS sample flow diagram depicts the sample filtering process that led to the specific samples being chosen for the ascending and descending aortic diameter GWAS.

The GWAS sample flow diagram depicts the sample filtering process that led to the specific samples being chosen for the ascending and descending aortic diameter GWAS.