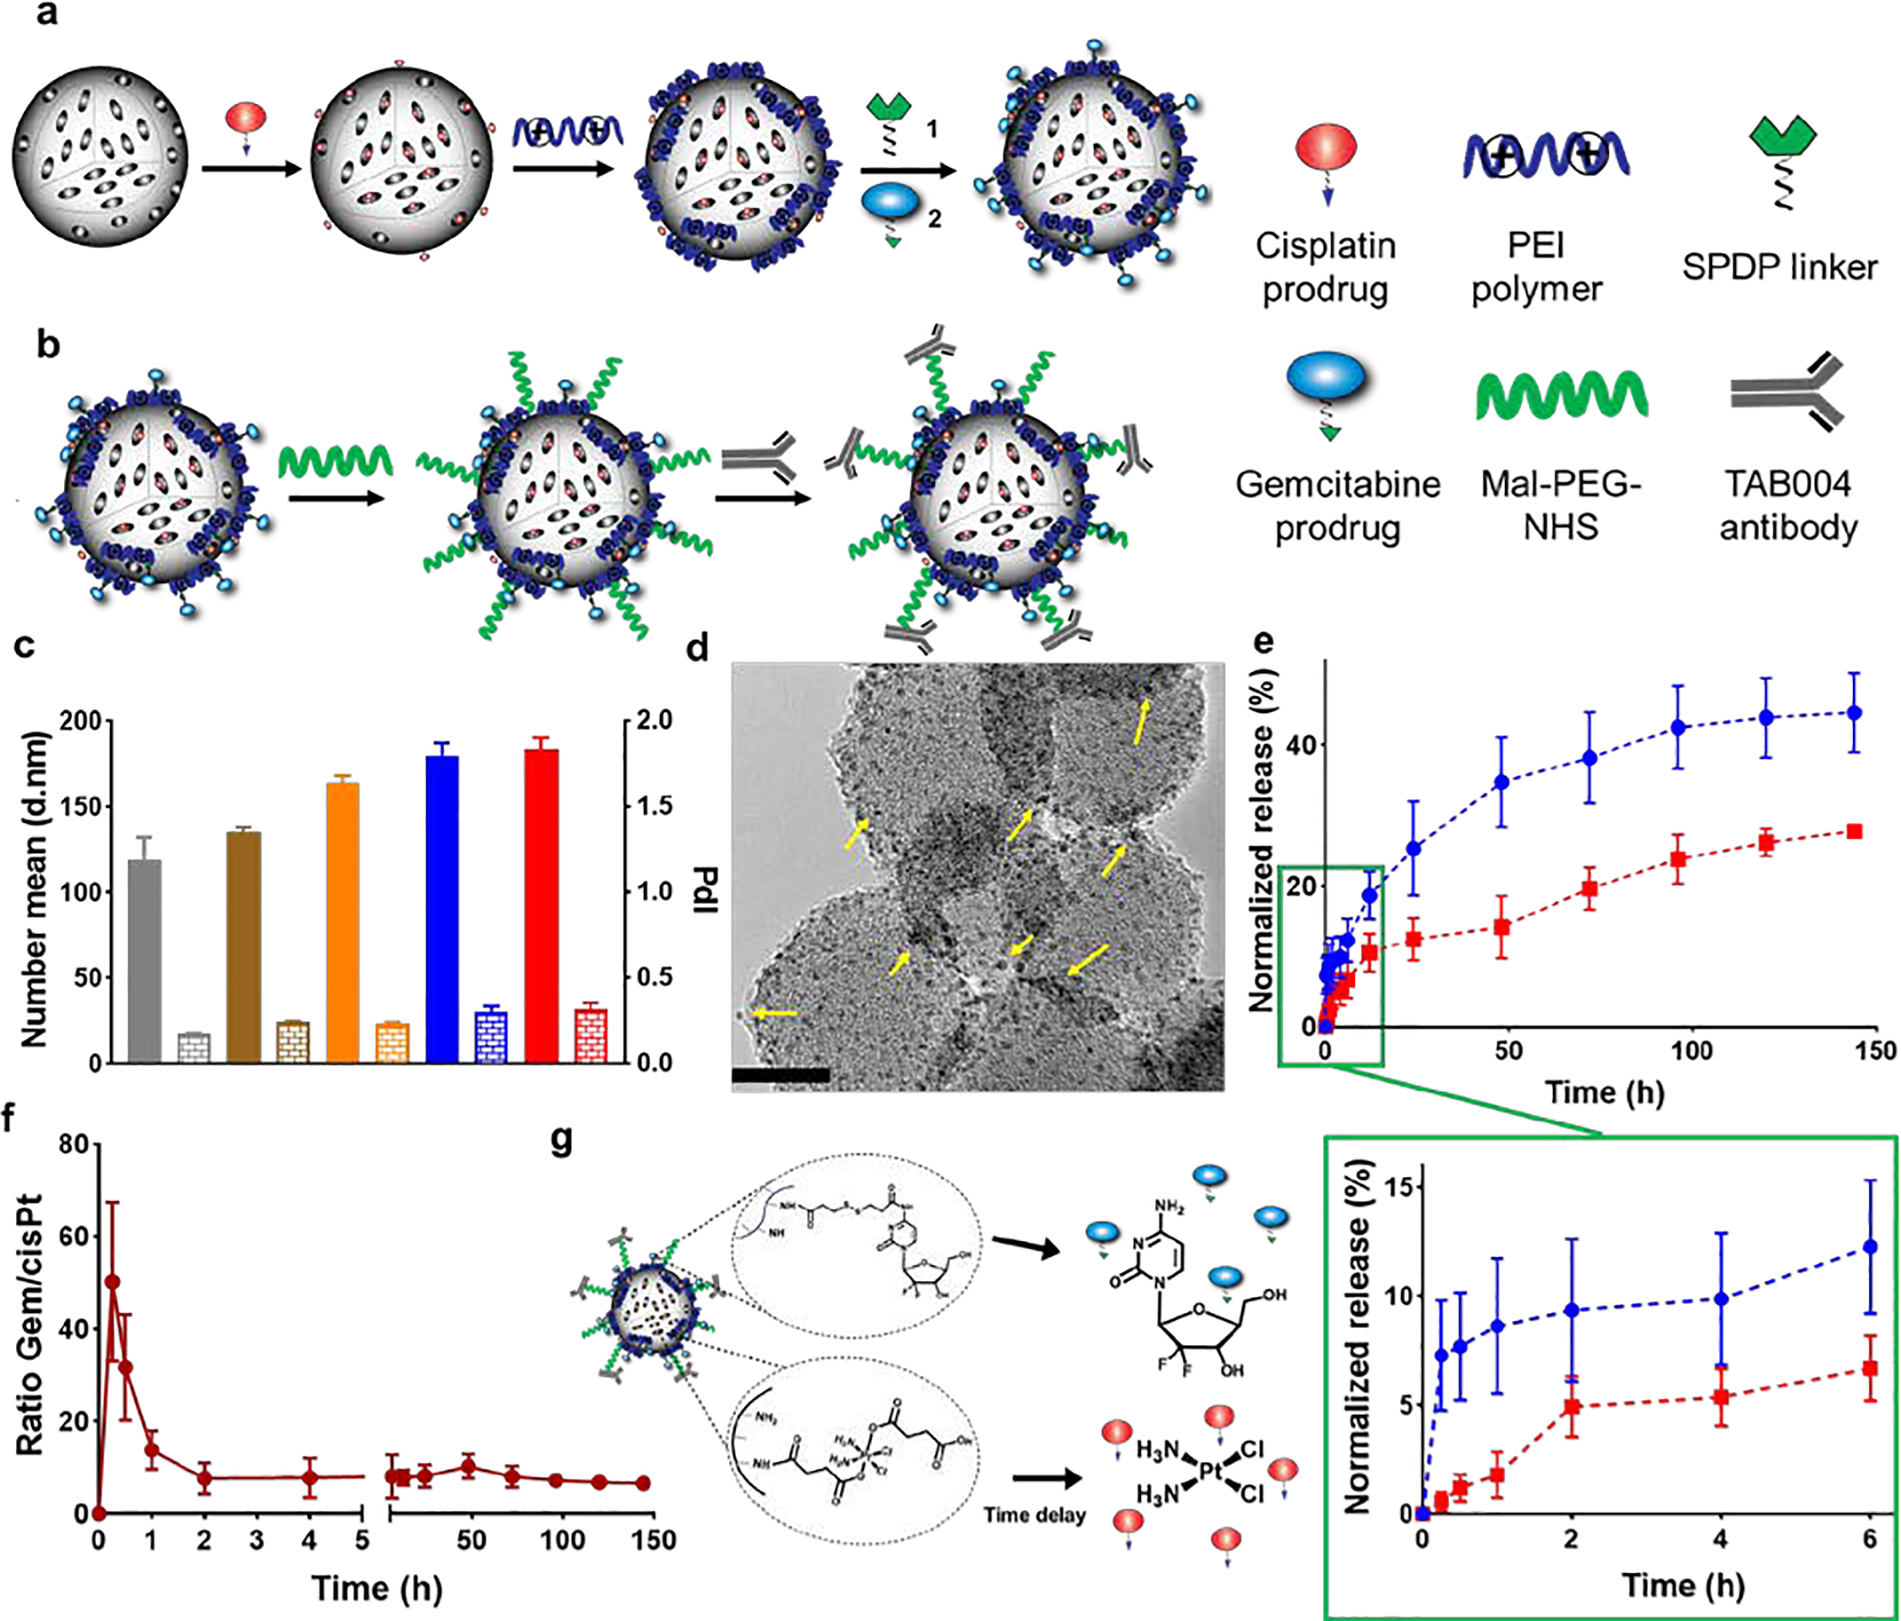
Figure 2.

Synthesis and physicochemical characterization of TAB004-Gem-cisPt-MSNs. (a, b) Schematic representation of the multistep procedure used for the synthesis of TAB004-Gem-cisPt-MSNs. (c) Hydrodynamic sizes (Dh) and polydispersity index (PdI) of AP-MSNs (gray), cisPt-MSNs (brown), Gem-cisPt-MSNs (orange), PEG-Gem-cisPt-MSNs (blue), and TAB004-Gem-cisPt-MSNs (red) in cell culture media supplemented with serum. Data represents the mean ± SD of three independent experiments (n=3). (d) TEM image of negatively stained TAB004-Gem-cisPt-MSNs, showing the functionalized antibody (yellow arrows). Scale bar = 20 nm. (e) Release profile of Gem (blue) and cisPt (red), in the presence of reducing agent. (below) Zoom-in of the first 6 hours showing fast release of Gem and the delay in cisPt release, which is characteristic of in situ differential release. Data represents the mean ± SD of three independent experiments (n=3). (f) Molar ratio of Gem/cisPt calculated at different times, showed a rapid release of Gem in the first 60 min afforded a high ratio of Gem/cisPt. However, the molar ratio reached a plateau after 2 h, and was then maintained value at which synergism was observed from CI studies. (g) Schematic representation of the drug release from Gem-cisPt-MSNs depicting the fast release of Gem followed by the delayed release of cisPt as dictated by the design features of the material.
