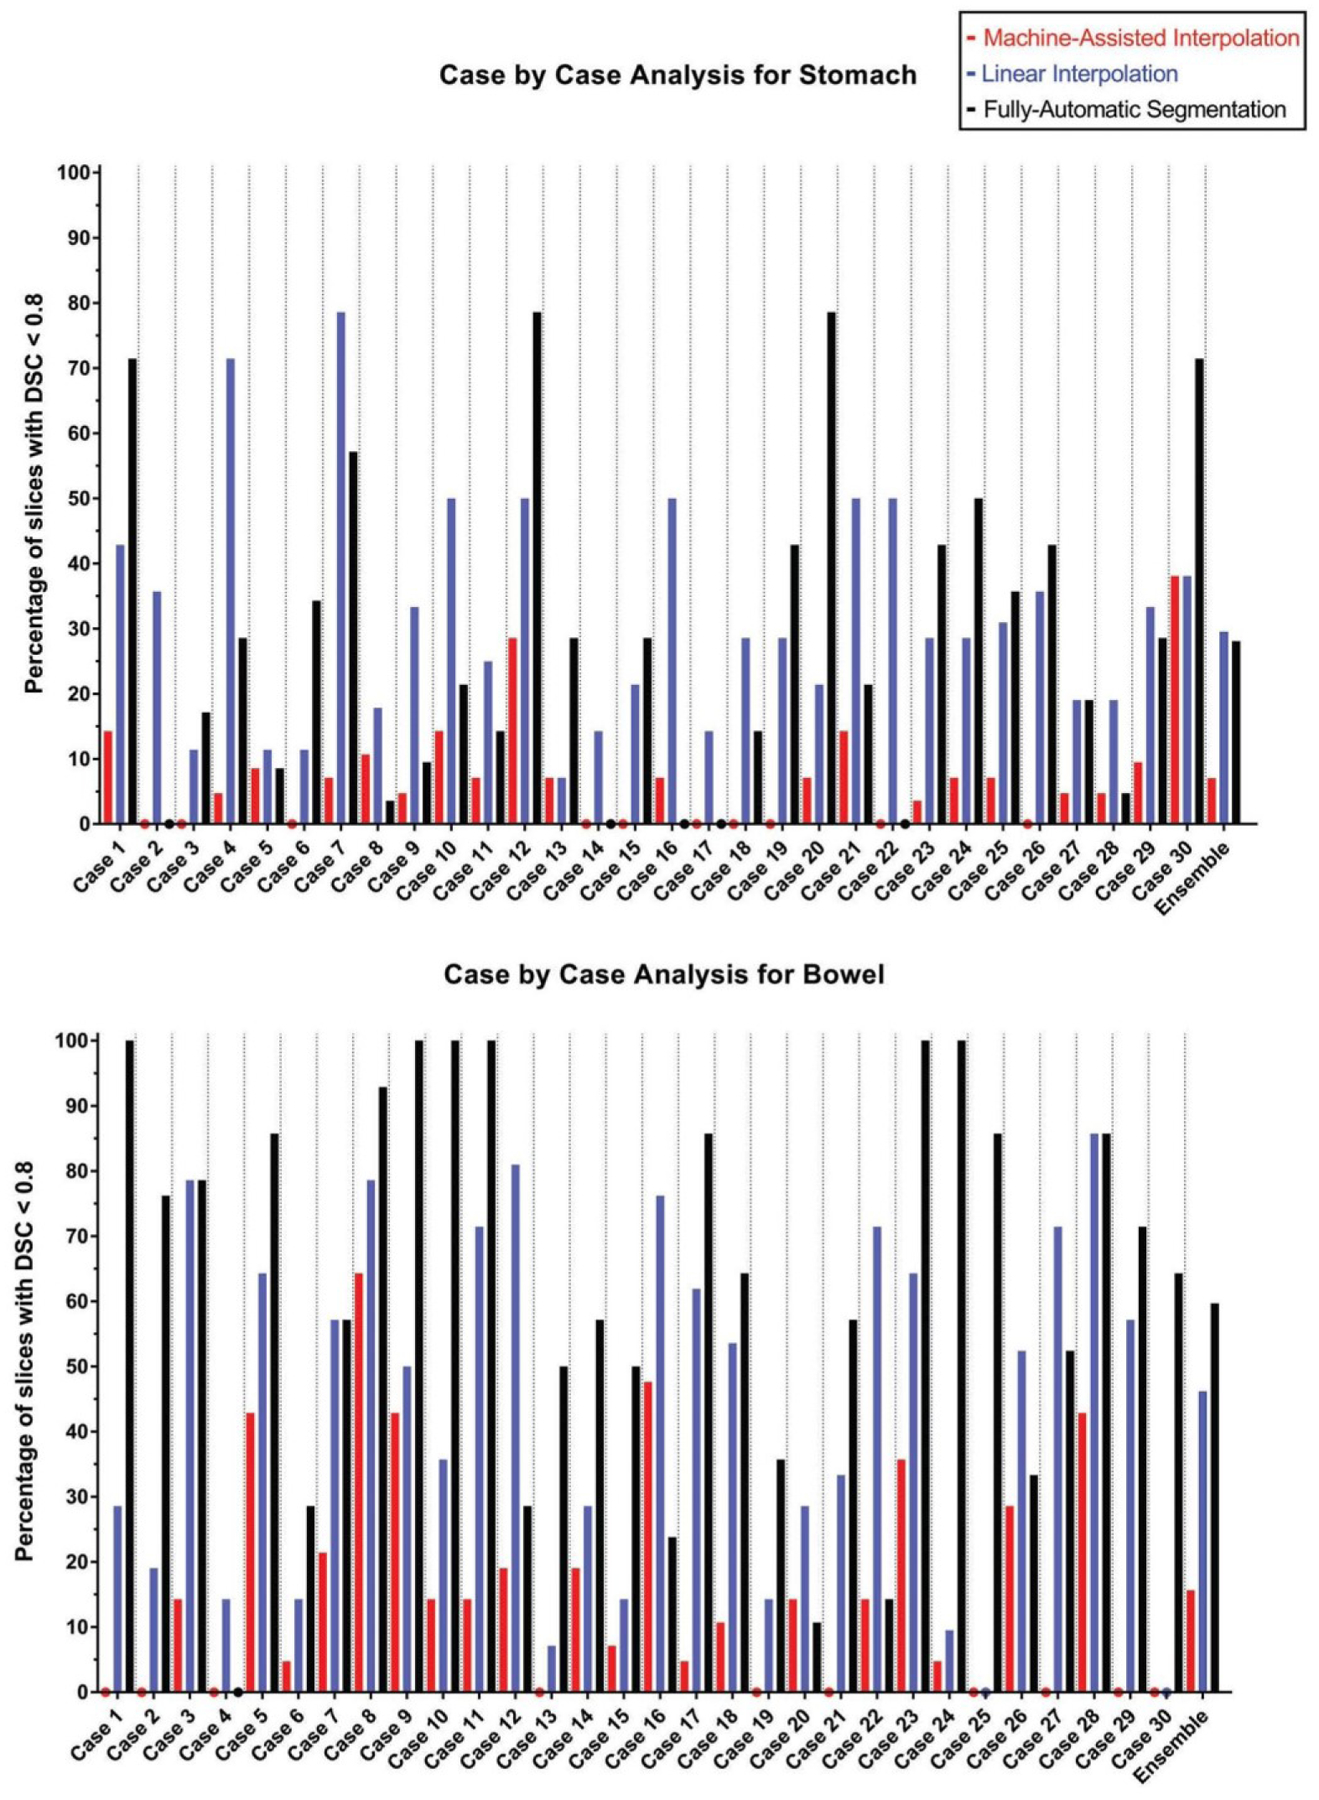
Figure 3:

The bar graphs show the percentage of slices with a DSC of less than 0.8 for each test case using MAI, LI, and FAS. The colored dots denote a value of 0% and the bar graphs to the far right show combined results over all test cases. MAI: Machine-Assisted Interpolation; LI: Linear Interpolation; FAS: Fully-Automatic Segmentation.
