
Figure 4. Loss of RON signaling in macrophages alters macrophage functions to inhibit tumor cell proliferation, survival, migration, and self-renewal.
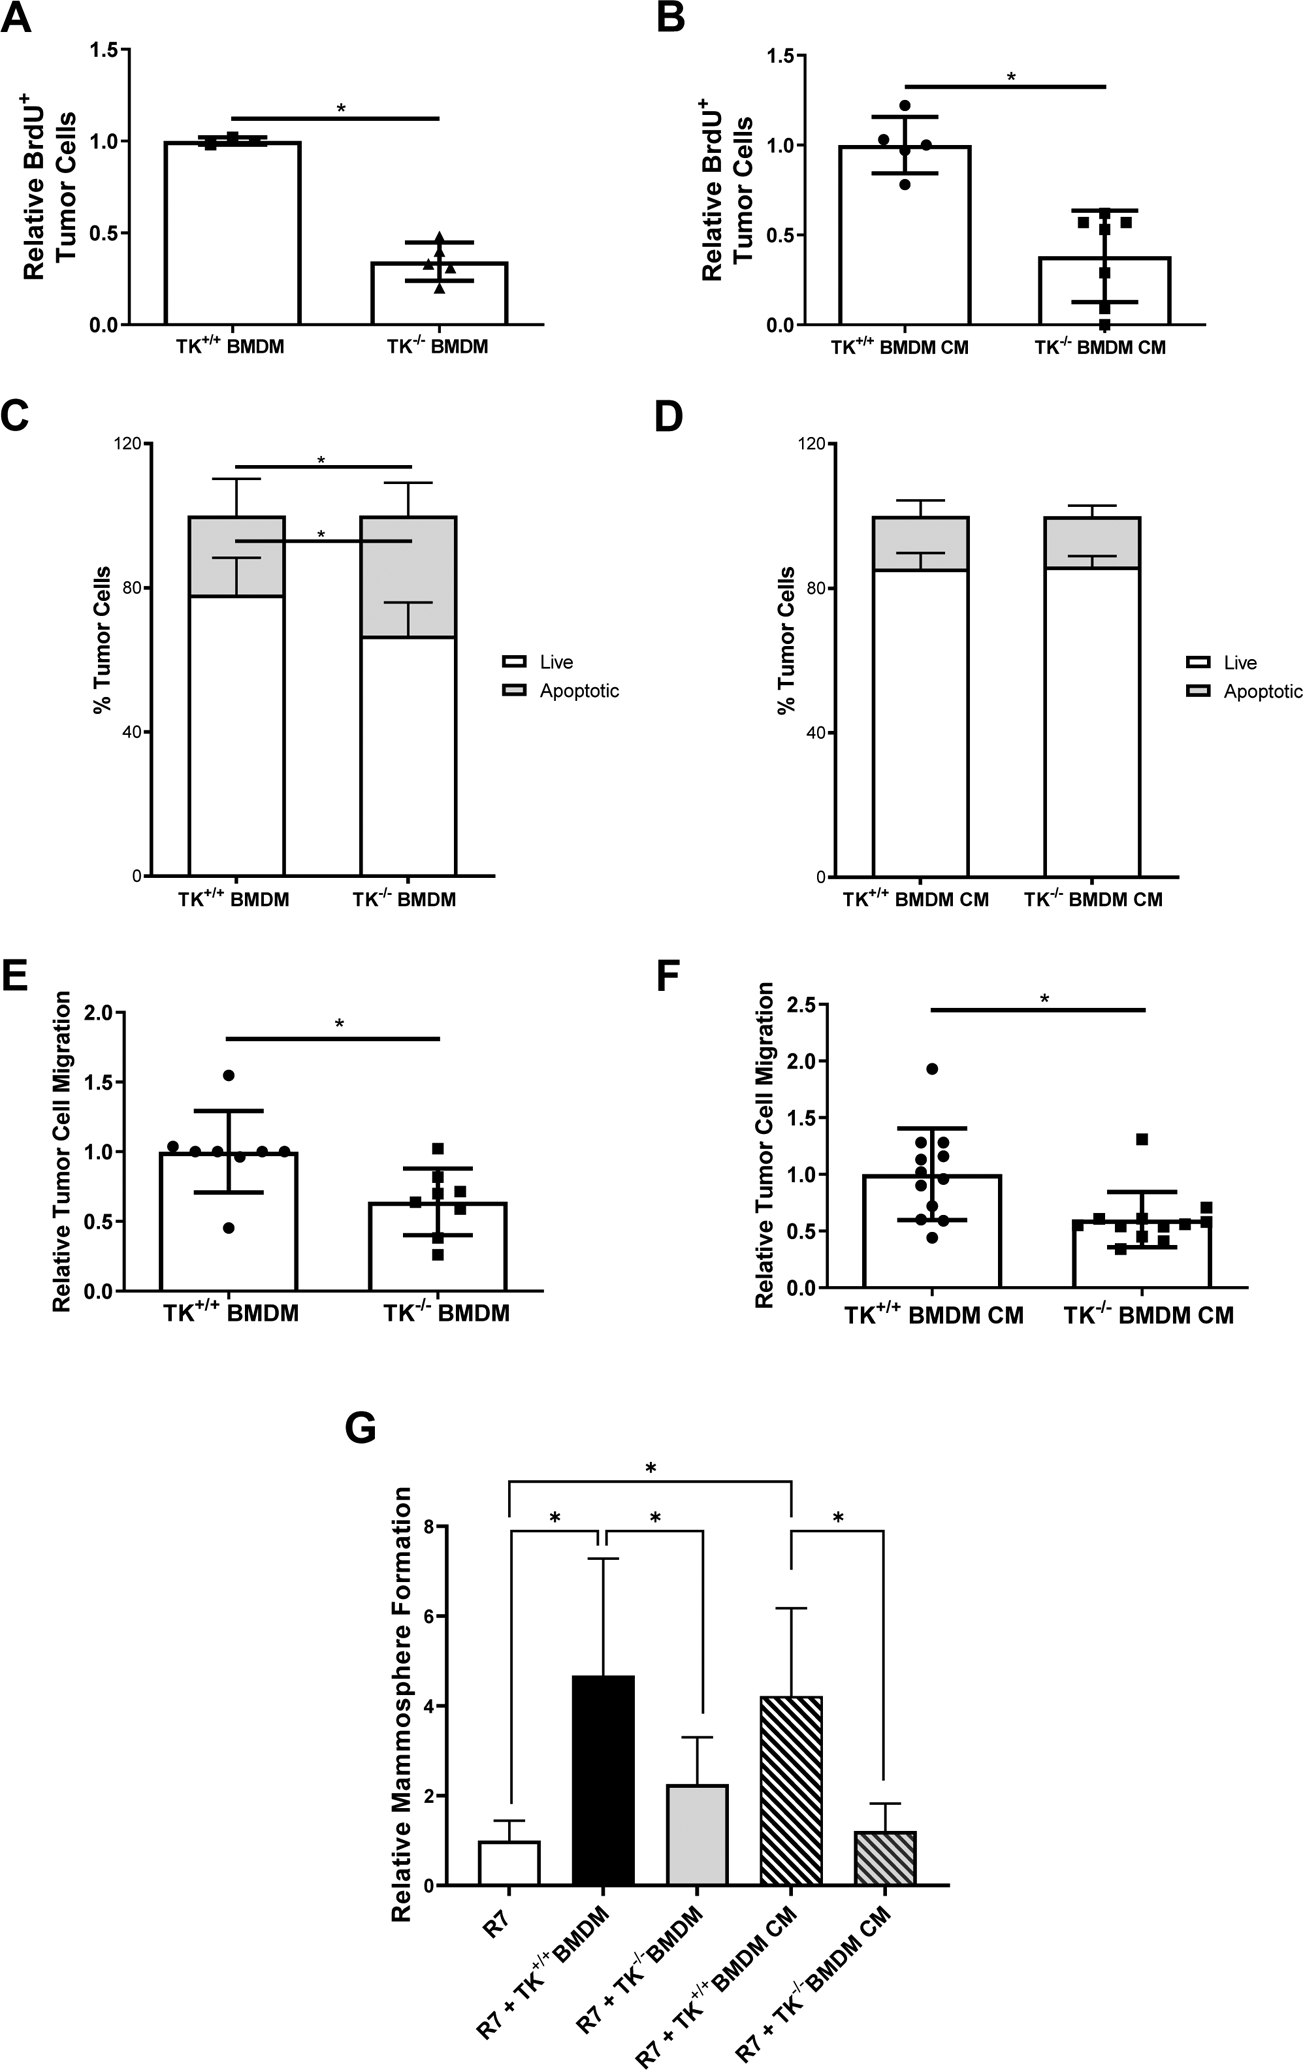
A-B) Relative BrdU positive R7 BCa cells when co-cultured with TK+/+ bone marrow derived macrophages (BMDMs) or TK−/− BMDMs (A) and TK+/+ BMDM conditioned media (CM) or TK−/− BMDM CM (B). Relative numbers represent the number of BrdU positive R7 BCa cells present in each experimental condition normalized to the number of BrdU positive R7 BCa cells present in its respective control group. (n=3). C) Annexin V/Propidium Iodide flow cytometry analysis showing the percent of R7 BCa cells that are viable (Live) or that are in early apoptosis, late apoptosis, or dead (Apoptotic) after co-culture with TK+/+ BMDMs or TK−/− BMDMs (n=3). D) Annexin V/Propidium Iodide flow cytometry data showing the percent of R7 BCa cells that are viable (Live) or that are in early apoptosis, late apoptosis, or dead (Apoptotic) after culture with TK+/+ BMDM CM or TK−/− BMDM CM (n=3). E-F) Relative R7 BCa cell migration toward TK+/+ BMDMs or TK−/− BMDMs (E) and TK+/+ BMDM CM or TK−/− BMDM CM (F) (n=3–6). G) Relative mammosphere formation of R7 cells cultured alone or co-cultured with TK+/+ BMDMs, TK−/− BMDMs, TK+/+ BMDM CM, or TK−/− BMDM CM (n=3). Statistical significance was determined using Student’s t-test (A-F) and a one-way ANOVA (G). Bars represent average values ± SD. * P<0.05.