FIGURE 2.
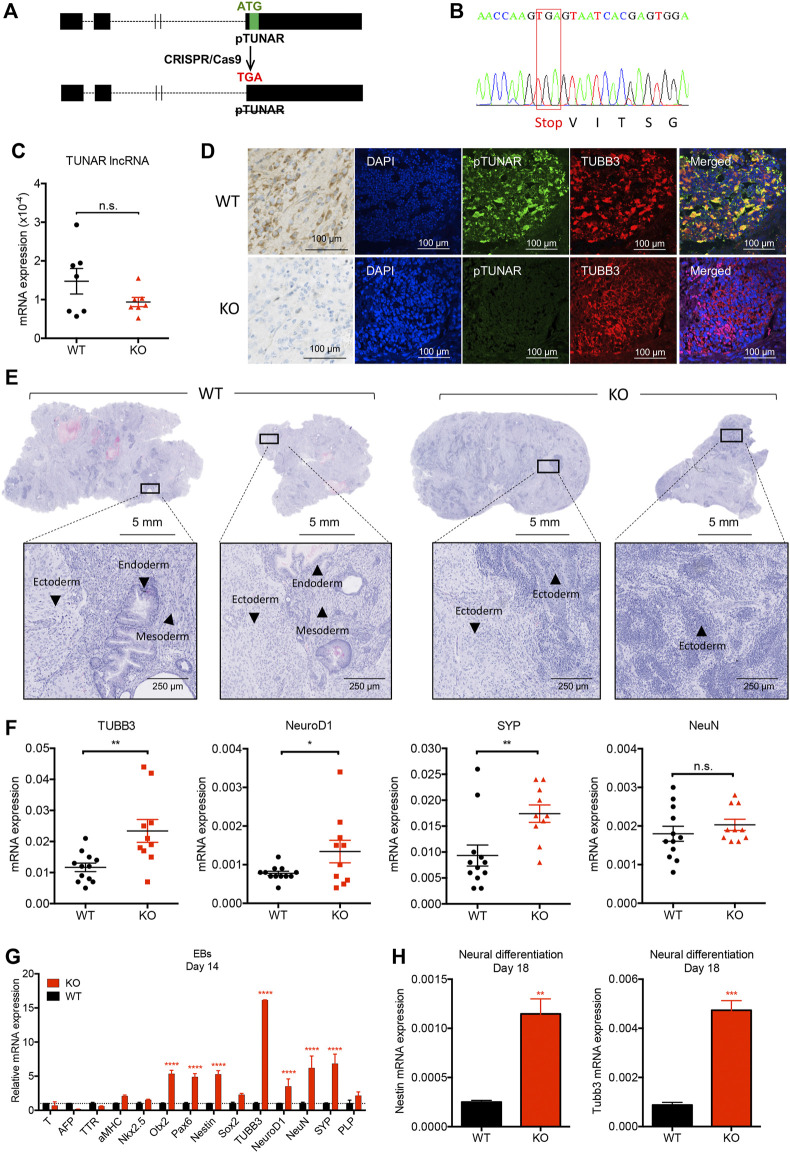
Analysis of pTUNAR deficiency in mouse embryonic stem cells (mESCs) differentiation. (A) Schematic representation of the pTUNAR-KO strategy. (B) Sequencing chromatogram showing homozygous substitution of pTUNAR ATG by a stop codon in pTUNAR-KO mESCs generated with the CRISPR/Cas9 system. (C) Expression analysis of TUNAR lncRNA in WT or pTUNAR-KO mESCs by qRT-PCR, normalized to GAPDH. (D) Immunofluorescence and immunohistochemistry images of teratomas generated with WT or pTUNAR-KO mESCs using a pTUNAR custom-made antibody. (E) Representative images of teratomas‘ hematoxilin and eosin staining. WT, wild type; KO, pTUNAR knock-out. (F) Expression analysis of the indicated genes in WT (N = 12) and pTUNAR-KO (N = 10) teratomas by qRT-PCR. Data are normalized to GAPDH. Statistical analysis is a t-test. * 0.05; ** 0.01; *** 0.001. (G) Gene expression analysis of the indicated genes by qRT-PCR in WT and pTUNAR-KO mESCs differentiated to embryoid bodies. Data are normalized to GAPDH and to control cells at day 14. Statistical analysis is a two-way ANOVA with multiple comparison. **** 0.0001. (H) Gene expression analysis of WT and pTUNAR-KO mESCs differentiated to neurons. Data are normalized to GAPDH. Statistical analysis is a t-test ** 0.01; *** 0.001.

