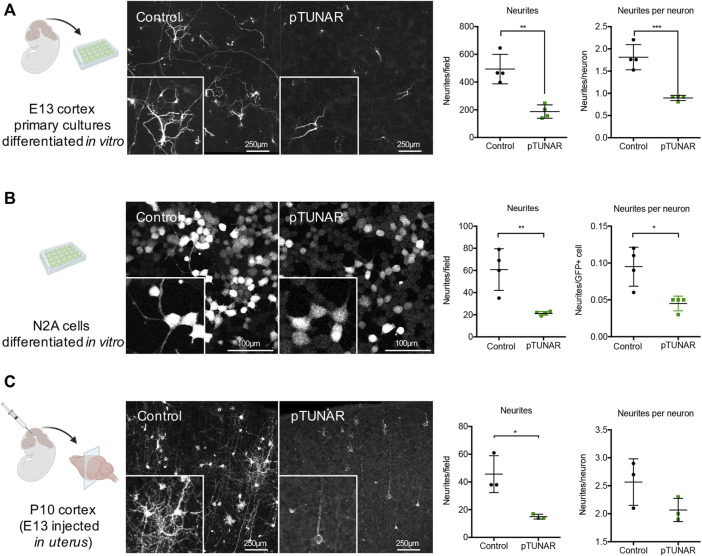
FIGURE 3.
Study of pTUNAR’s role in neurite formation. (A) Schematic representation of the experiment: E13 cortex primary cultures, transfected with a CAG-GFP or a CAG-pTUNAR-IRES-GFP plasmid and differentiated for 7 days in vitro (left). Representative images of the cells stained with a GFP antibody (middle). Quantification of the neurites observed in different fields and proportion of neurites/neuron (right). (B) Schematic representation of the experiment: N2A cells transduced with lentiviral vectors encoding either GFP or pTUNAR-IRES-GFP and differentiated for 72 h with serum deprivation (1% FBS) (left). Representative images of cells stained with a GFP antibody (middle). Quantification of the neurites observed in different fields and proportion of neurites/neuron (right). (C) Schematic representation of the experiment: P10 cortex developed after in uterus injection at embryonic day E13 with a retroviral vector encoding RFP and a lentiviral vector encoding pTUNAR-IRES-GFP (left). Representative images of cortical neurons stained with RFP (control) and a GFP (pTUNAR) antibodies (middle). Quantification of the neurites observed in different fields and proportion of neurites/neuron (right). Statistical analysis is a t-test * 0.05; ** 0.01; *** 0.001. The illustrations in this figure were created using BioRender.com.

