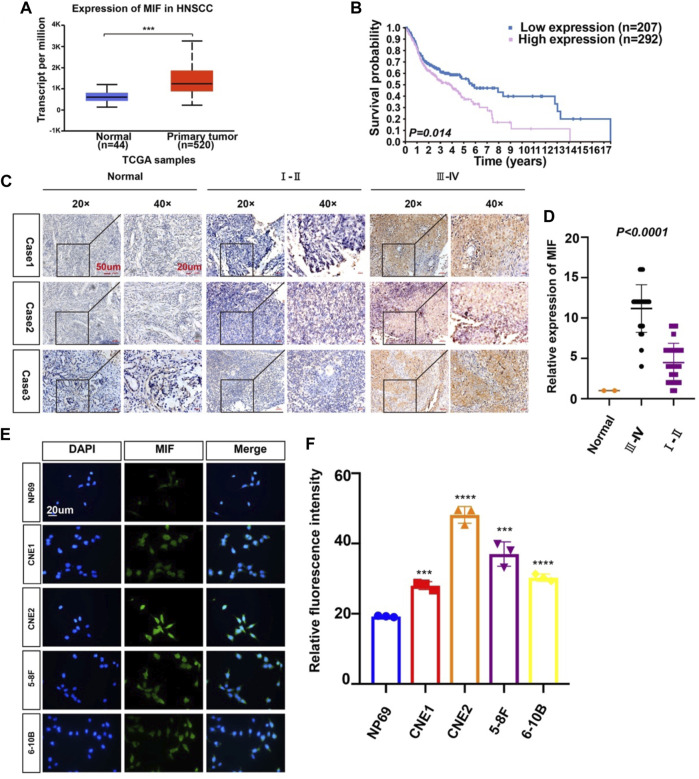
FIGURE 1.
MIF expression in human nasopharyngeal carcinoma is higher than that in normal tissues. (A) Statistical comparison of MIF expression across TCGA database, one-way ANOVA. (B) Statistical analyses of the association of MIF expression with the survival time of the patients. Log-rank test. (C) Immunohistochemical staining of MIF in patient specimens of different stages. (D) The IHC staining score of MIF in NPC tissues was defined as low expression (scores of 0–8) or high expression (scores of 9–16) by X-tile Software. Then, Kaplan-Meier analysis was used to compare MIF IHC staining scores of patients in different stages. e MIF levels in NP-69 and NPC cell lines were examined by IF (unpaired t-test). CNE-1, CNE-2, 5–8F, and 6–10B are human NPC cell lines; NP-69 is an immortalized normal nasopharyngeal epithelial cell line. Scale bar:20 um. f Statistics of fluorescence intensity through ImageJ, unpaired t-test. All graphs show the mean ± SEM of at least three independent experiments. *p < 0.05, **p < 0.01, ***p < 0.001.

