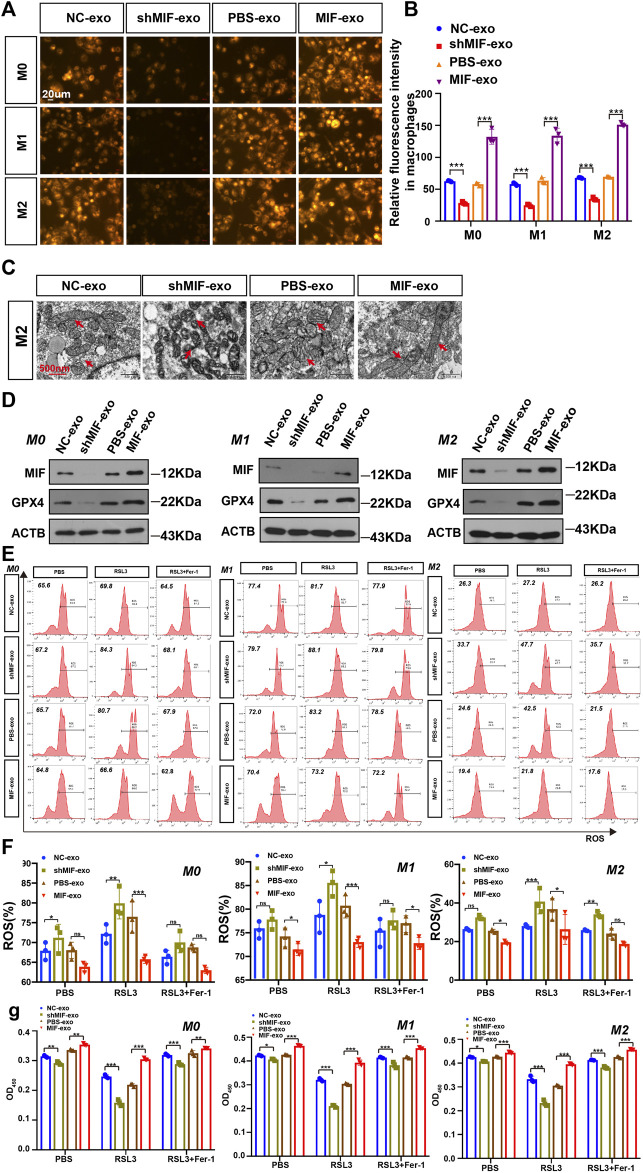
FIGURE 6.
Exosomal MIF inhibits ferroptosis of macrophages in vitro. (A) FerroOrange experiment involving staining of divalent iron in macrophages. Scale bar:20 um. (B) Statistical analysis of the fluorescence intensity of ferrous iron. (C) Representative transmission electron microscopy (TEM) images of M2 macrophages. Scale bar:500 nm. Red arrows indicate mitochondria. (D) WB analysis of the relationship between GPX4 and MIF expression levels in M0, M1 and M2 macrophages. (E,F) Flow cytometry of ROS in macrophages (Two-way ANOVA). (G) Cell death was estimated by CCK8 assay (Two-way ANOVA). All graphs show the mean ± SEM of at least three independent experiments. *p < 0.05, **p < 0.01, ***p < 0.001.

