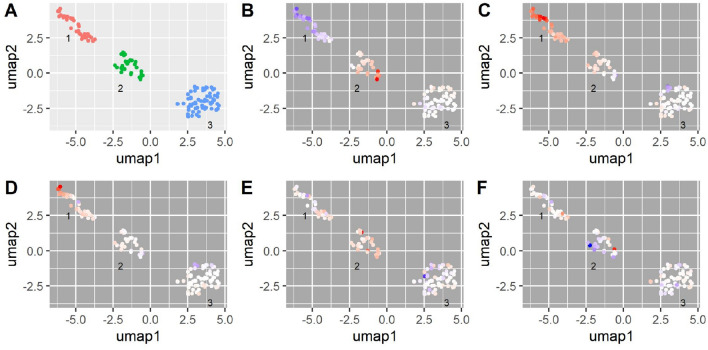
Fig. 4.
PHEWAS-based clustering of mtDNA-CN associated SNPs. UMAP clusters created from PHEWAS associations for mtDNA-CN associated SNPs. A Three clusters were identified as labeled in the panel; orange indicates no cluster. B–F SNPs are colored based on their effect estimate size, standardized to the effect on mtDNA-CN (red = positive, blue = negative estimates), for B platelet count, C mean platelet volume, D platelet distribution width, E serum calcium levels, F mean spherical cellular volume

