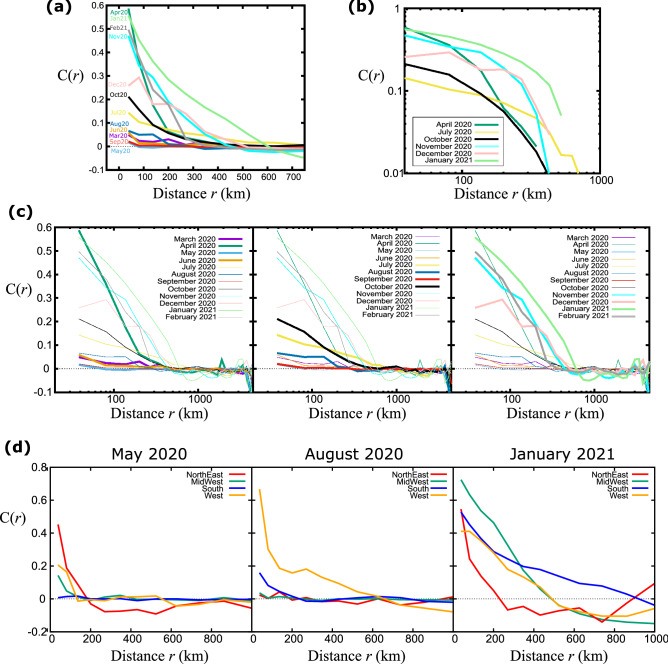
Figure 2.
Decay of the correlation function with distance. (a) The correlation function as a function of the distance, averaged over all counties in the United States. Different curves correspond to different instances of time, for the first two weeks of the month from March 2020 to February 2020. (b) Same plot as in (a) in double logarithmic axes for select months. (c) For clarity, we split the plot in (a) into three different time intervals and focus on four months within these intervals. (d) Comparison of the correlation functions, averaged over all counties within the four US regions, for May 2020, August 2020, and January 2021.

