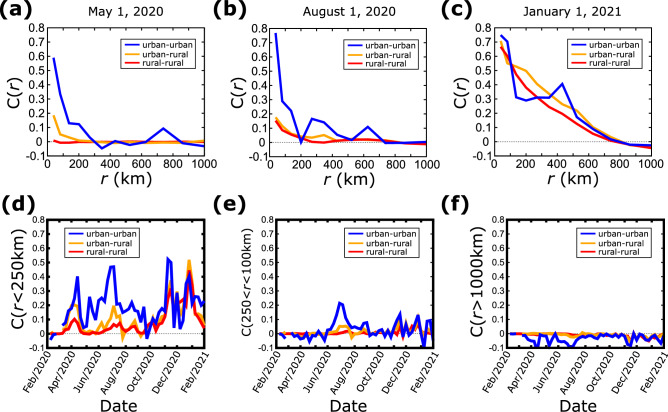
Figure 4.
Spatial correlations between areas of different population (a–c) Correlation function C(r) between urban–urban, urban–rural, and rural–rural counties, as a function of the distance at three different times. (d) Average correlation function between urban–urban, urban–rural, and rural–rural counties which are within 250 km from each other, as a function of time. (e) Same plot as in (d) for county distances between 250 and 1000 km. (f) Same plot as in (d) for distances longer than 1000 km.

