Figure 4.

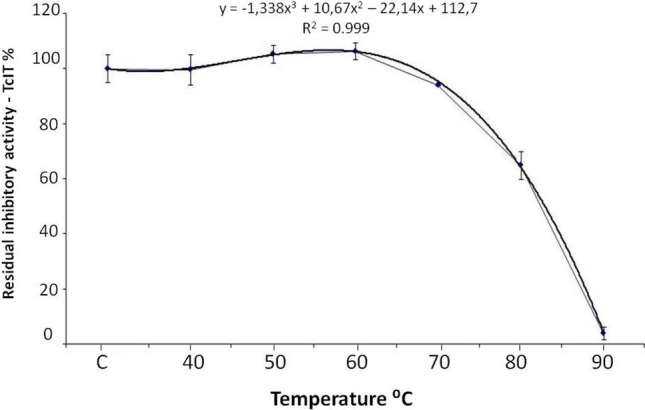
Thermostability of rTcTI at different temperatures. On the X axis, C represents the control reaction performed at 37 °C. The Y axis represents the percentage of rTcTI inhibitory activity in comparison with the control reaction.

Thermostability of rTcTI at different temperatures. On the X axis, C represents the control reaction performed at 37 °C. The Y axis represents the percentage of rTcTI inhibitory activity in comparison with the control reaction.