Figure 5.
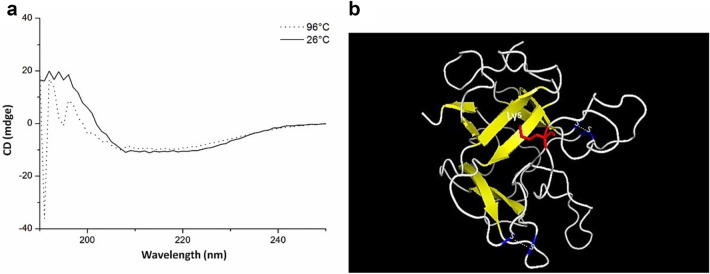
TcTI is rich in loops. (a) Circular dichroism analysis of rTcTI protein. The sweep was between 150 and 250 ηmol L−1 wavelengths, and the dotted line and the continuous line show the scan profile at 96 °C and 26 °C, respectively. (b) Three-dimensional model of T. cacao TcTI by homology to mold 3IIR. The protein has antiparallel leaves-β [yellow] and predominance of loops [gray]. The two bisulfide bridges are marked in blue, indicating the cysteine residues. Inhibitory residue [lysine] is marked in red.

