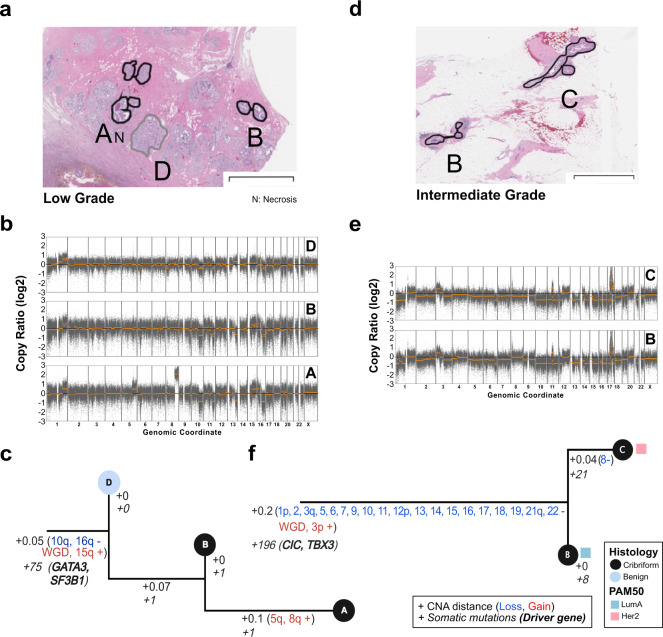
Fig. 3. Clonal relationships of multi-region DCIS.
Multi-region phylogenetic reconstruction using both CNA and somatic mutations for MCL76_061_16200 (a–c) and MCL76_077_15300 (d–f). For each case, the spatial annotation of the microdissected regions on the H&E images (a, d), corresponding copy number profiles (b, e), and phylogenetic trees (c, f) are displayed. Copy number profile plots show bins (gray dots) and segment (orange) log2 copy number ratio (y-axis). The phylogenetic tree leaves (single dissected region) are colored according to histological type and the branches (hamming distances based on CNA segments) are annotated with corresponding specific somatic alterations or their total number (CNA: regular, genes: italic font). The tree root corresponds to an inferred normal diploid ancestor. PAM50 subtype of the region is indicated when available. Annotations and trees are available for ten additional samples in Supplementary Fig. 4. The scale bars in panels a and b correspond to a size of 3 mm.

