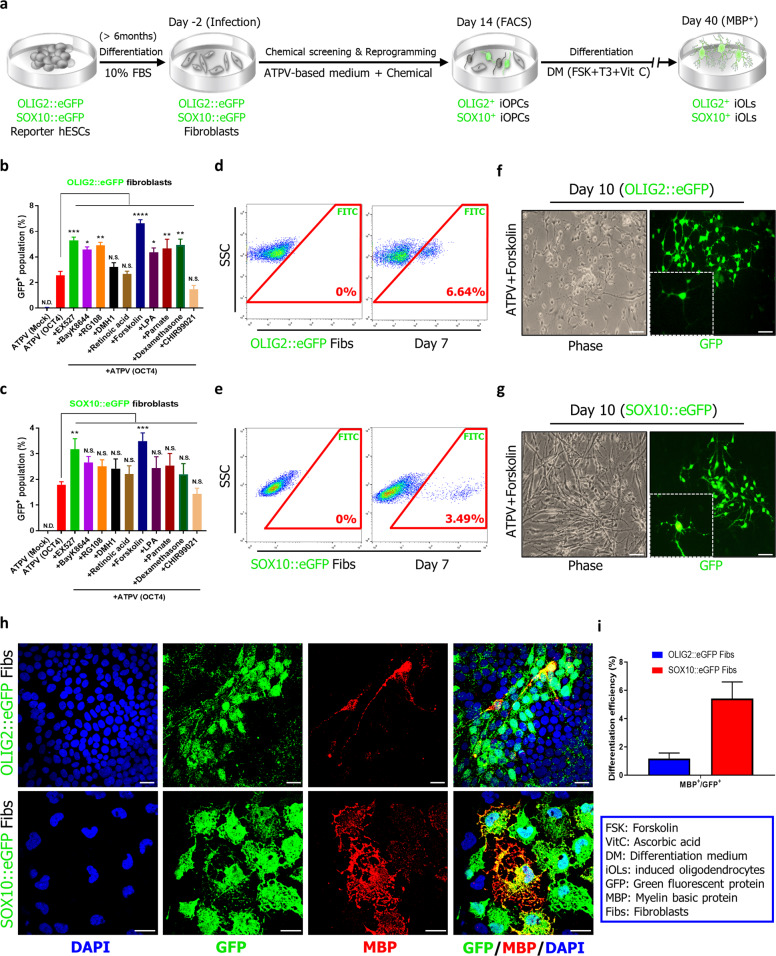
Fig. 1. Screening for inducing OLIG2+ and SOX10+ oligodendrocyte progenitor cells from human fibroblasts.
a A schematic representation of the protocol followed for the direct conversion of hESC-derived fibroblasts to OLIG2+ and SOX10+ oligodendrocyte progenitor cells. The OLIG2 and SOX10::eGFP fibroblasts were transduced with OCT4 and cultured in ATPV-based medium containing each of additional small molecules. To differentiate into oligodendrocytes, the medium was changed to differentiation medium (DM) containing forskolin (FSK), T3, and ascorbic acid (Vit C). b, c Quantitation of GFP+ populations in flow cytometry analysis following the induction of OLIG2::eGFP and SOX10::eGFP fibroblasts with OCT4 under various chemical combinations in culture. The data from four independent experiments are presented as the mean + SD. *, statistically significant difference vs. the ATPV culture condition. Significant differences were analyzed by one-way ANOVA. N.S., not significant; N.D., not detected. *P < 0.05, **P < 0.01, ***P < 0.001, ****P < 0.0001. d, e Representative flow cytometry data for GFP+ cells in OCT4-induced OLIG2::eGFP and SOX10::eGFP fibroblasts cultured in the presence of ATPV and forskolin. The data from three independent experiments are presented as the mean values. f, g Representative phase contrast (left), and green fluorescence intensity images (right) for GFP+ cells in OCT4-induced OLIG2::eGFP and SOX10::eGFP fibroblasts cultured in the presence of ATPV and forskolin. Scale bars, 100 µm. The boxed area in the image on the left represents a magnified (3×) picture of GFP+ cells. h Representative fluorescence images for the differentiation of OCT4-induced OLIG2::eGFP and SOX10::eGFP fibroblasts cultured in the presence of ATPV and forskolin into oligodendrocytes on day 60. The GFP+ cells coexpressed MBP. Scale bars, 100 µm. i Quantification of MBP-positive cells in GFP-positive cells on day 60.

