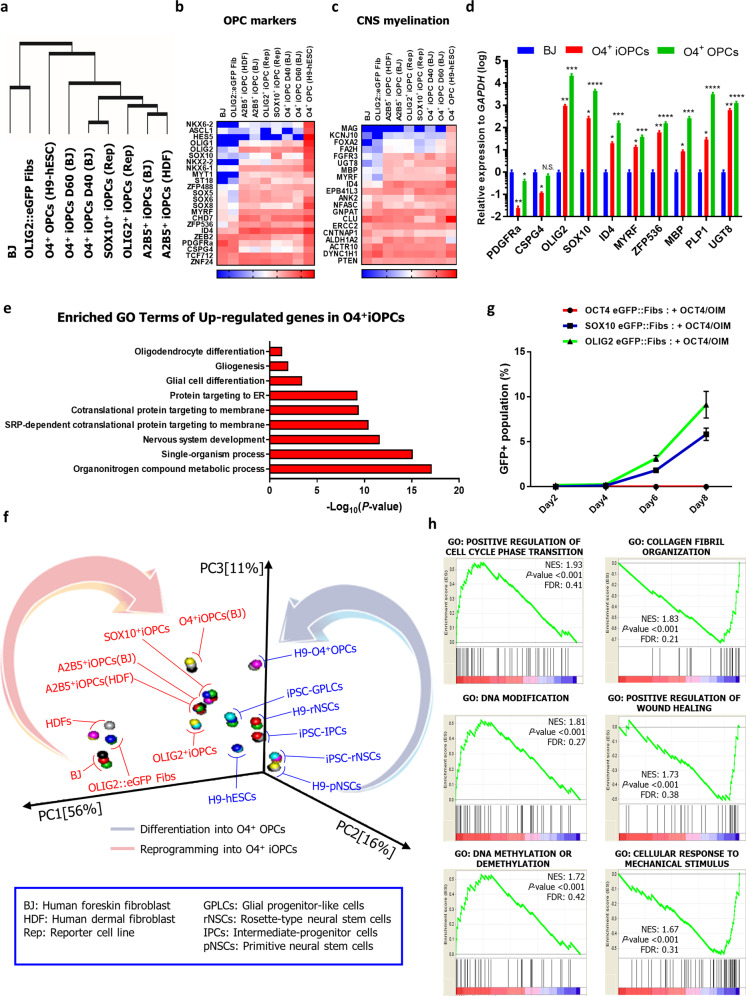
Fig. 3. Analysis of gene expression profiles of iOPCs by RNA-seq.
a The hierarchical clustering of 11,426 genes (FDR < 0.05) between samples from the RNA-sequencing data of A2B5+ iOPCs (derived from BJ and human dermal fibroblasts), OLIG2+ iOPCs (derived from OLIG2::eGFP fibroblasts), SOX10+ iOPCs (derived from SOX10::eGFP fibroblasts), O4+ iOPCs (derived from BJ on day 40 and 60), O4+ OPCs (derived from H9-hESCs on day 60), OLIG2::eGFP fibroblasts and human fibroblasts (BJ). b, c The RNA-seq profiles of gene categories are depicted as heatmaps. d Comparative qPCR analysis of O4+ iOPCs, O4+ OPCs, and BJ. The data represent the mean + SD (n = 3). *, statistically significant difference vs. BJ cultured in OIM. *P < 0.05, **P < 0.01, ***P < 0.001, ****P < 0.0001 by one-way ANOVA (N.S., not significant). e The enriched GO terms (biological processes) of upregulated genes in O4+ iOPCs relative to BJ. The P-value of each GO term is presented on the x-axis of a log10 scale. f Principal-component analysis (PCA) of the various samples mentioned in (a) and a previous study (Yun et al., 2019). pNSCs, primitive NSCs; rNSCs, rosette-type NSCs; IPCs, intermediate progenitor cells; GPLCs, glial restricted progenitor-like cells. g A quantitative representation of the flow cytometry analysis. The data from three independent experiments are presented as the mean ± SD. h Gene set enrichment analysis (GSEA) between a group of iOPCs and a group of fibroblasts. The group of iOPCs included A2B5+ iOPCs (BJ), A2B5+ iOPCs (HDF), OLIG2+ iOPCs, SOX10+ iOPCs, O4+ iOPCs (D40), and O4+ iOPCs (D60). The group of fibroblasts included BJ, OLIG2::eGFP fibroblasts, and HDFs.

