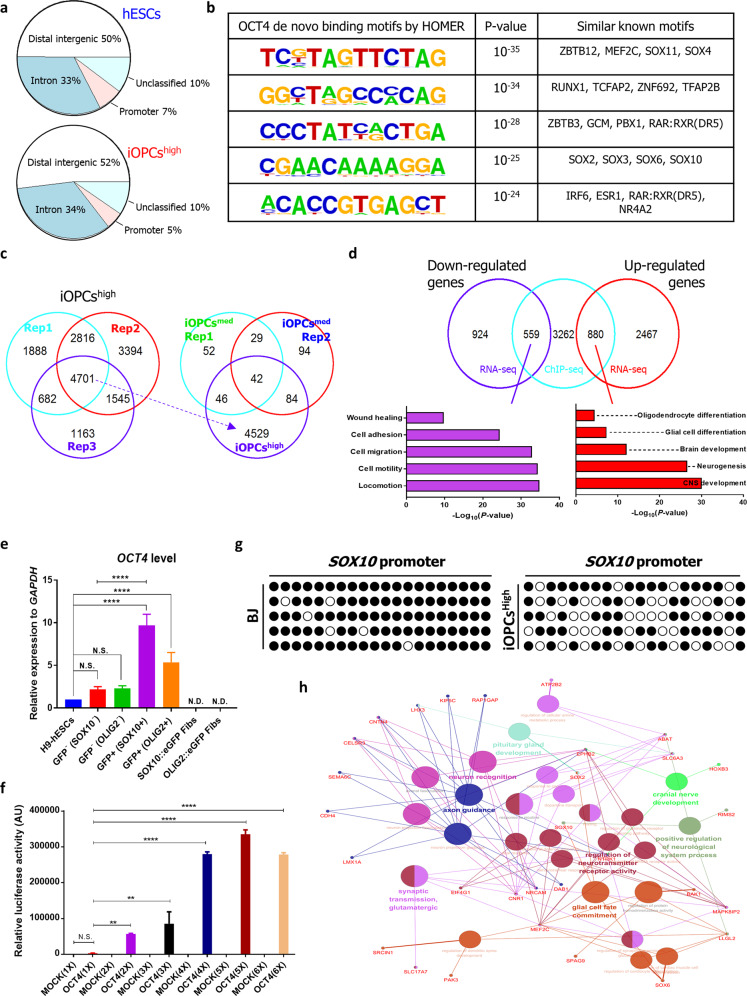
Fig. 4. Genome-wide sequencing and analysis of OCT4 binding sites in iOPCs.
a Annotation of OCT4 peaks as regulatory elements in H9-hESCs and A2B5+ iOPCs (iOPCshigh). b The putative OCT-4 binding motifs that were enriched for transcription factors in A2B5+ iOPCs (iOPCshigh) as determined by HOMER software. c A Venn diagram showing the genes containing OCT4-binding regions that overlapped among three biological replicates. d A Venn diagram showing the overlap of four-fold up- or downregulated genes identified by RNA-seq (right and left, respectively) in A2B5+ iOPCs (BJ) relative to BJ with putative OCT4 target genes (derived from ChIP-seq, middle). The P-values of each GO term for the overlapped genes (559 and 880) are presented on the x-axis of a log10 scale. e Comparative qPCR analysis of OCT4 expression in hESCs, GFP−, and GFP+ cells. The expression is shown relative to that of H9-hESCs, and normalized to GAPDH. The data are represented as the mean + SD (n = 3). *, statistically significant difference vs. H9-hESCs. Significant differences were analyzed by one-way ANOVA. N.S., not significant; N.D., not detected. *P < 0.0001. f SOX10 promoter luciferase assay in fibroblasts infected with the pMXs-hOCT4 and pMXs vectors (MOCK). The level of OCT4 (1X) was comparable to that of H9-hESCs. Average values from three independent experiments are shown. *, statistically significant difference vs. OCT4 (1X). Significant differences were analyzed by one-way ANOVA. N.S., not significant. **P < 0.01, ****P < 0.0001. g Bisulfite sequencing analysis of the SOX10 promoter in A2B5+ iOPCs (iOPCshigh) and control BJ fibroblasts. The open circles represent unmethylated CpG sites, and the black circles represent methylated CpG sites. h GO term enrichment analysis of the genes associated with CNS development by ClueGO showed that genes involved in glial cell fate commitment, the regulation of neurotransmitter receptor activity, and axon guidance were significantly enriched.

