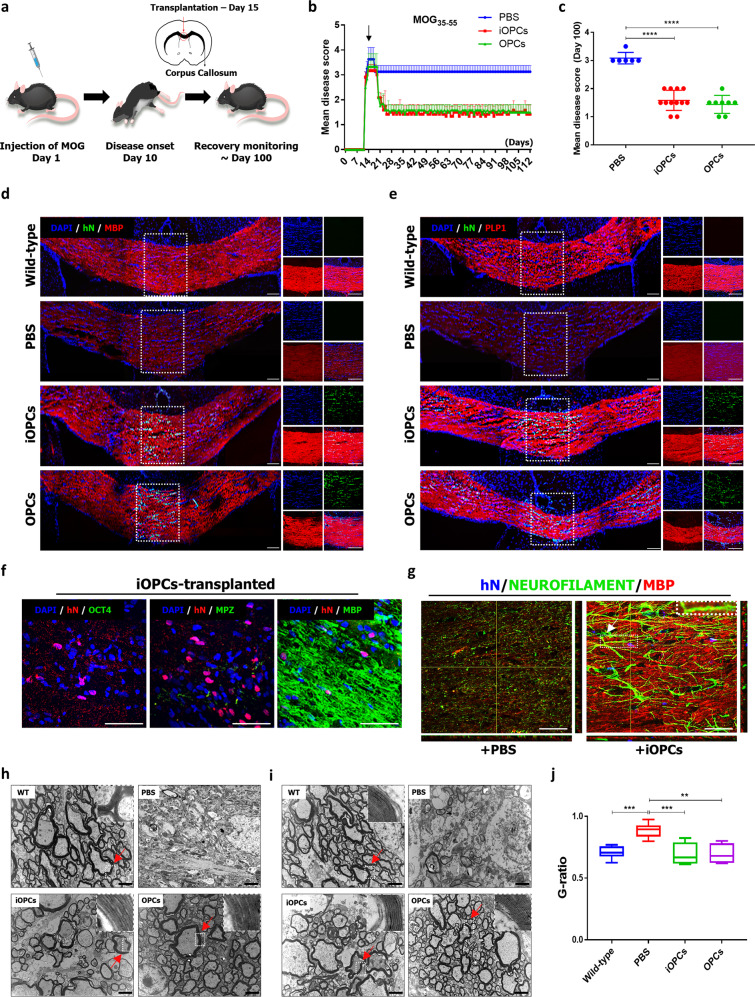
Fig. 6. iOPCs alleviate disease severity in an MOG-induced EAE model.
a A schematic overview of iOPC transplantation in an MOG-induced EAE mouse model. b, c The disease severity scores of PBS-treated, iOPCs- engrafted, and OPCs- engrafted MOG-induced EAE mice over 100 days. OPCs and iOPCs were engrafted on day 15 after MOG-induced disease induction (black arrow). The values represent the mean ± s.e.m.; n = 6–12 mice per group. Significant differences were analyzed by one-way ANOVA. ****P < 0.0001. d, e Representative fluorescence images on day 100 post-disease induction. The right panels represent multichannel immunofluorescence images of the boxed areas in the corresponding left panels. Scale bars, 100 µm. f Representative fluorescence images 100 days after transplantation. Scale bars, 100 µm. g Representative fluorescence images of in vivo myelination. The boxed area in the image on the right represents a magnified (3×) picture of neurons myelinated by iOPC-derived oligodendrocytes (white arrow). Scale bars, 30 µm. Representative electron microscope images of PBS-treated brains of EAE mice, iOPCs- engrafted brains of EAE mice, OPCs- engrafted brains (h) and spinal cord (i) of EAE mice, and untreated brains of wild-type mice. The samples were obtained 14 weeks after engraftment. The arrows denote the original position of magnified picture. Scale bars, 2 µm. j The comparison of the g-ratios among the PBS-treated brains of shiverer mice, iOPC- engrafted brains of shiverer mice, OPC- engrafted brains of shiverer mice, and untreated brains of wild-type mice. The graph represents the g-ratio obtained from axons with a diameter >1 µm. *, statistically significant difference vs. PBS-treated group. Significant differences were analyzed by one-way ANOVA. **P < 0.01, ***P < 0.001.

