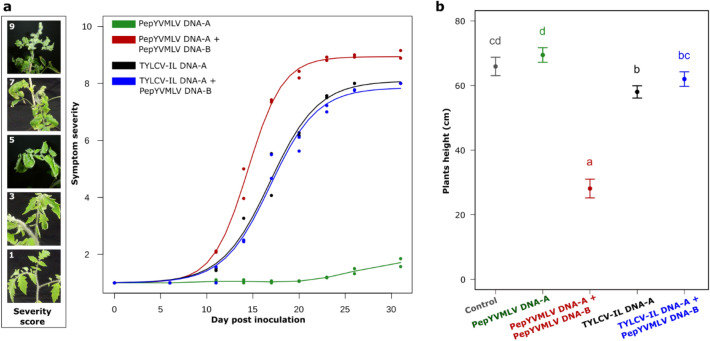
Figure 2.
(a) Kinetics of estimated symptom severity of tomato (yellow) leaf curl disease following agroinoculation of tomato plants with PepYVMLV DNA-A and TYLCV-IL DNA-A in single (green and black lines) or mixed (red and blue lines) infection with DNA-B, respectively. Each point represents the average for one experiment (n = 30). The symptom severity scale (left scale bar) ranges from 1 (no symptoms) to 10 (plant death). (b) Mean height of tomato plants after agroinfection with PepYVMLV DNA-A or TYLCV-IL in single or mixed infection with DNA-B at 32 days post inoculation. For each dot, vertical bars represent 95% confidence intervals. Identical letters on top of the bars indicate groups with non-significant differences in height.

