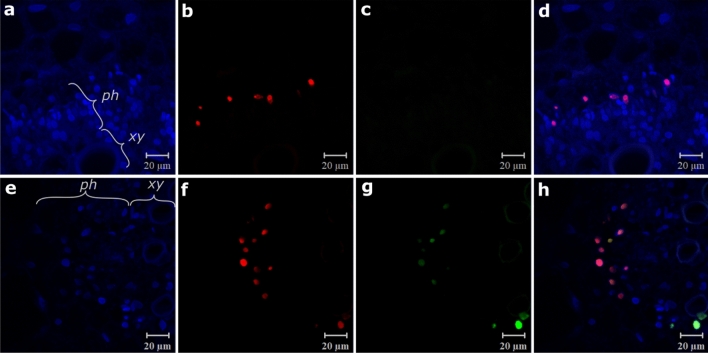
Figure 4.
Location of PepYVMLV DNA-A in single (a–d) or mixed (e–h) infection with DNA-B in cross sections of infected tomato petioles. DNA-A (b,f) and DNA-B (c,g) components revealed by red and green FISH probes, respectively. Nuclei are stained with DAPI blue. Images (d,h) in which the three channels (blue, red, and green) are merged enable identification of the components located together in the cell nuclei. Phloem (ph) and xylem (xy) bundles are indicated.

