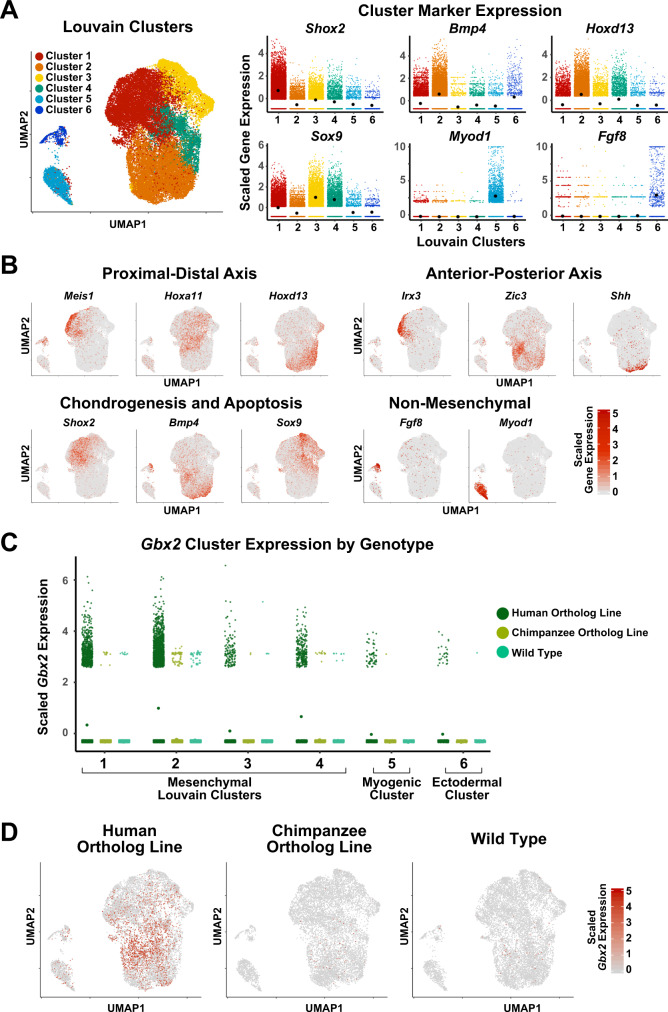
Fig. 4. Single-cell transcriptome analysis of E11.5 hindlimb bud in HACNS1 knock-in, chimpanzee ortholog line, and wild type embryos.
A Left: UMAP embedding of HACNS1 homozygous, chimpanzee ortholog line, and wild type cells. The colors indicate cell clusters identified by Louvain clustering. Right: Expression of known limb bud cell-type marker genes in each cluster. Black dots denote cluster mean expression. B UMAP embedding of hindlimb bud cells from HACNS1 homozygous, chimpanzee ortholog line, and wild type, showing expression of proximal-distal, anterior-posterior, chondrogenesis-apoptosis, and non-mesenchymal markers. See text and Supplementary Fig. 4 for details. C Expression of Gbx2 in each Louvain cluster, separated by genotype. Dots denote cluster mean expression. D UMAP embeddings illustrating cells expressing Gbx2 (indicated in red) in HACNS1 homozygous, chimpanzee ortholog line, and wild type cells. All gene expression data shown in plots and UMAP embeddings (A–D) were imputed using ALRA and centered and scaled using z-scores (see “Methods”)81.

