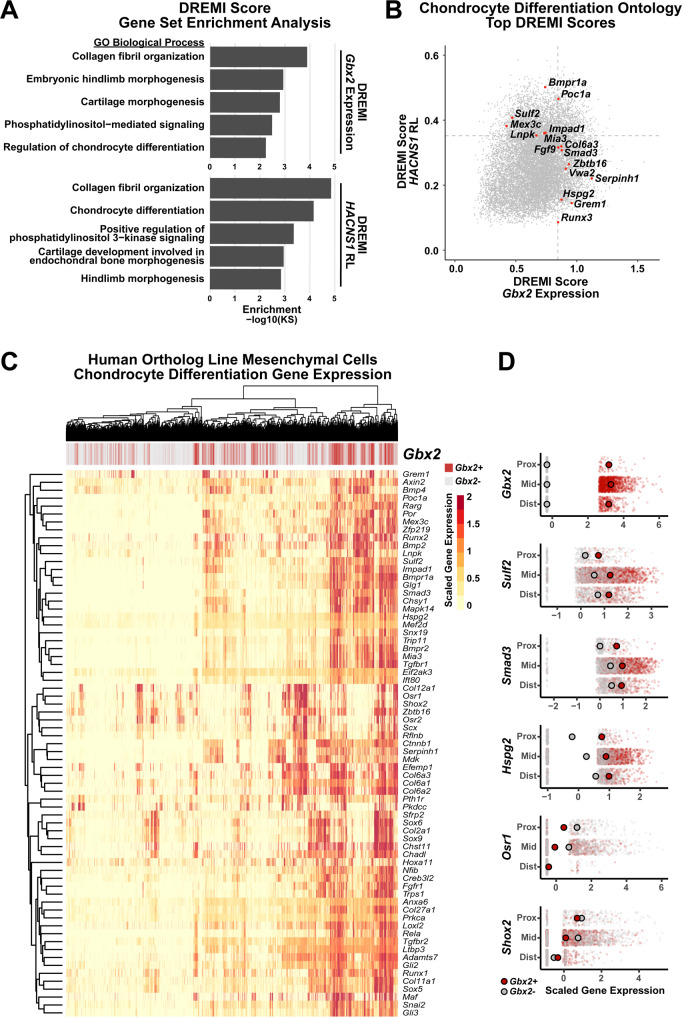
Fig. 5. Gbx2-positive mesenchymal cell expression of chondrocyte differentiation markers in HACNS1 homozygous limb bud.
A Ontology enrichments of genes with expression associated with Gbx2 expression (top) and the relative likelihood of the HACNS1 knock-in condition (HACNS1 RL, bottom) in HACNS1 homozygous mesenchymal cells. The log-transformed Gene Set Enrichment Analysis Kolmogorov–Smirnov P value for each category is plotted on the x-axis. Ontologies shown are those overlapping in the Gbx2 expression and HACNS1 RL ontology enrichment lists. See also Supplementary Data 5 and 6. B HACNS1 RL and Gbx2 kNN-DREMI scores are plotted for all genes. Genes ranked in the top 20% of kNN-DREMI scores in the Chondrocyte Differentiation ontology (GO:0002062) for the union of the HACNS1 RL and Gbx2 kNN-DREMI analysis gene lists are colored in red and labeled. Dotted lines indicate the top 20% of values for each dataset. C Heatmap showing expression of genes belonging to the ontology “Chondrocyte Differentiation” (GO:0002062) in all HACNS1 homozygous mesenchymal cells (Louvain clusters 1–4). Hierarchical clustering was used to determine the order of cells (in columns) and genes (in rows). The bar at the top of the heatmap shows Gbx2-positive and Gbx2-negative cells in red and gray, respectively. D Expression of selected genes in Gbx2-positive (red) versus Gbx2-negative (gray) mesenchymal cells belonging to Louvain clusters 1 and 2, partitioned by proximal-distal axis markers as follows: Proximal cells (Prox) are Meis1+, Hoxd13−, Hoxa11−; distal cells (Dist) are Hoxd13+, Hoxa11− and Meis1−; and intermediate cells (Mid) are all remaining Hoxa11 + cells. Cells were randomly down-sampled to enable comparison of equal numbers of Gbx2-positive and Gbx2-negative cells. Larger red and gray dots respectively denote mean expression of each indicated gene in each group in Gbx2-positive and Gbx2-negative cells. All gene expression values shown in C and D were imputed using ALRA and centered and scaled using z-scores (see “Methods”)81.

