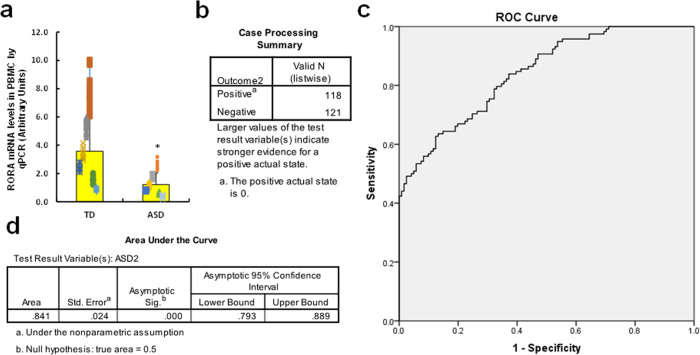
Fig. 8. Establishment of ROC curve as an autistic marker based on RORA expression.
a Three milliliter of peripheral blood was withdrawn from either typical developing (TD, n = 118) and ASD (n = 121) children (2–6 years old), and the PBMC were isolated for RORA mRNA analysis through real-time quantitative PCR. b–d The RORA mRNA levels were used to draw the ROC (receiver operating characteristic) curve. b Case processing summary, positive represents TD cases, and negative represents ASD cases. c ROC curve. d Area under the curve. *, P < 0.0001, vs. TD group. Data were expressed as mean ± SEM.

