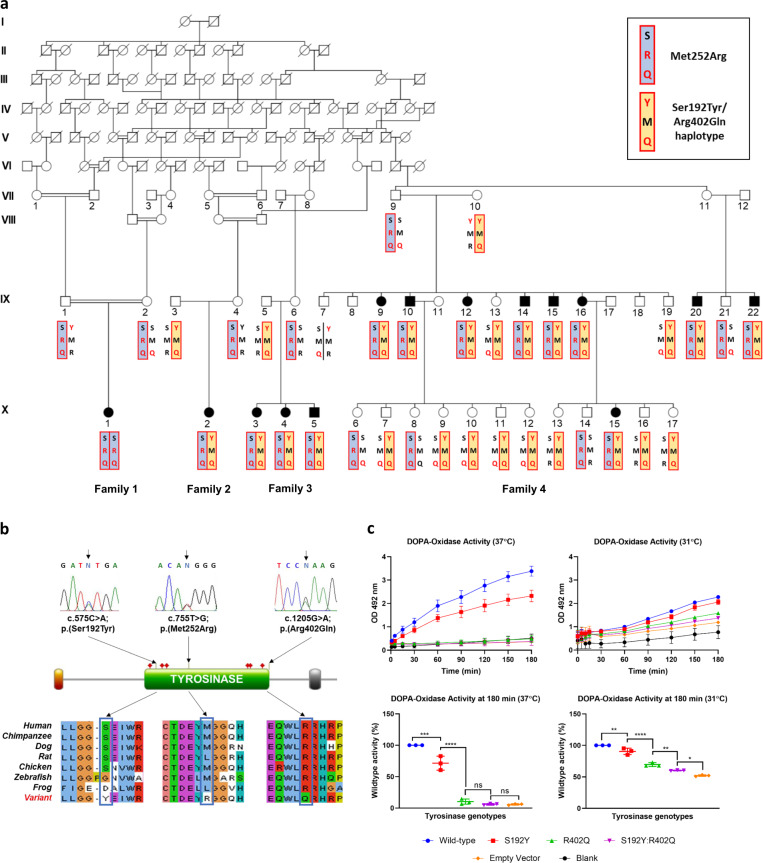
Fig. 1. Pedigree diagrams, TYR genotype and functional data.
a Pedigree diagram showing segregation of TYR variants p.(Ser192Tyr), p.(Arg402Gln) and p.(Met252Arg) (highlighted in red). The two disease-causing haplotypes are shaded; the p.(Met252Arg) haplotype in blue, and the p.(Ser192Tyr)/p.(Arg402Gln) in cis haplotype in yellow. b Sequence chromatograms showing TYR c.575 C > A; p.(Ser192Tyr), c.755 T > G; p.(Met252Arg) and c.1205 G > A; p.(Arg402Gln) variants in heterozygous form. Schematic localisation of TYR p.(Ser192Tyr), p.(Met252Arg) and p.(Arg402Gln) variants within the catalytic tyrosinase domain of the TYR polypeptide. The p.(Ser192Tyr) and p.(Arg402Gln) variants are located at or near the copper-containing catalytic binding sites (the red diamonds denote the histidine residues that bind to copper atoms and hence structurally coordinate the positions of the metal-binding sites). Conservation of TYR p.(Ser192Tyr), p.(Met252Arg) and p.(Arg402Gln) variants across species. c Tyrosinase activity in wild-type, p.(Ser192Tyr)/S192Y mutant, p.(Arg402Gln)/R402Q mutant and double-mutant HEK293 cells. The absorbance of dopachrome, a product synthesised by the transformation of L-DOPA by tyrosinase was quantified as a measure of tyrosinase activity in wild-type and TYR-mutant cell lines. Cumulative production of dopachrome (top row) was quantified from the start of L-DOPA treatment (0 min) to 180 min. Statistical differences between cell lines were analysed at 180 min (bottom row). Data are shown as mean ± SEM and statistically significant differences between groups are indicated by asterisks (*p < 0.05, **p < 0.01, ***p < 0.001, ****p < 0.0001); ns not significant.

