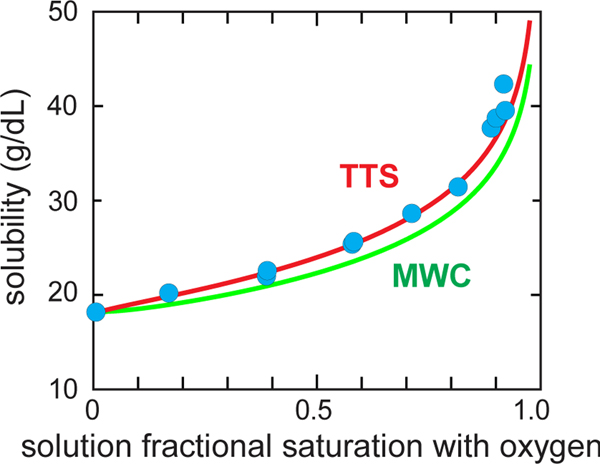
Fig. 4.
Measured solubility of HbS as a function of the fractional saturation with oxygen of the free hemoglobin molecules. The blue circles are the measured solubilities.(Sunshine et al., 1982) The green (MWC) curve utilizes the Gill-Wyman polyphasic linkage relation to calculate the solubility from the free HbS cooperative binding curve and the polymer binding curve assumed to be the non-cooperative binding curve of the T quaternary structure of free hemoglobin.(Sunshine et al., 1982) The red (TTS) curve is the predicted solubility of the TTS model calculated in the same way, after adjusting one parameter of the TTS model that lowers the affinity of polymerized HbS compared to T, i.e. l, the ratio of t tertiary conformations to r tertiary conformations at zero oxygen pressure in the polymerized T conformation.

