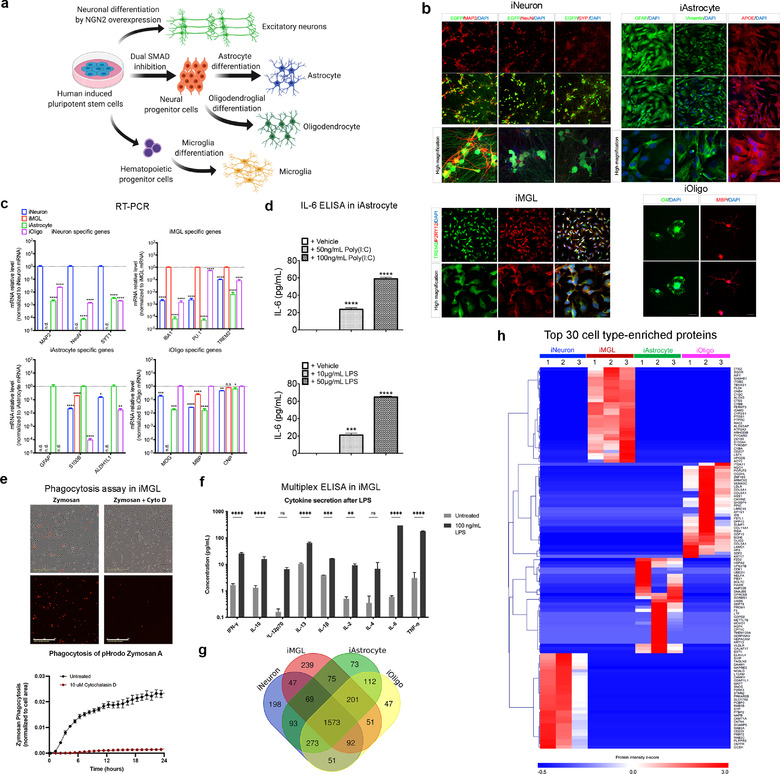
FIGURE 1.

Brain cell type differentiation and characterization. (a) Schematics for the excitatory neuron, astrocyte, microglia, and oligodendrocyte differentiation from hiPSCs. (b) Representative immunofluorescent images of cell type specific markers. iPSC‐induced excitatory neurons (iNeurons) were stained for neuron‐specific markers (MAP2, NeuN, and SYP; synaptophysin). Scale bar, 75 and 20 μm (high magnification). iPSC‐derived microglia‐like cells (iMGLs) were stained for microglia‐specific markers (TREM2 and P2RY12). Scale bar, 30 μm (upper) and 10 μm (lower). iPSC‐derived astrocytes (iAstrocytes) were stained for astrocyte‐specific markers (GFAP, Vimentin, and APOE). Scale bar, 75 and 20 μm (high magnification). iPSC‐derived oligodendrocyte‐like cells (iOligos) were stained for oligodendrocyte‐specific markers (O4 and MBP). Scale bar, 75 μm. (c) qRT‐PCR of cell type‐specific markers for iNeuron (MAP2, NeuN and SYT1), iMGL (IBA1, PU.1 and TREM2), iAstrocyte (GFAP, S100B and ALDH1L1), and iOligo (MOG, MBP and CNP) showing the relative mRNA levels of these genes normalized by the specified cell type. Data are presented as mean ± SEM. n.d., non‐determined; *p < 0.05, **p < 0.01, ***p < 0.001, and ****p < 0.0001, determined by one‐way ANOVA with Dunnett's multiple comparisons. (d) IL‐6 secretion following 24 h of treatment with poly(I:C) and lipopolysaccharide in iAstrocytes (n = 3). Data are presented as the mean ± SEM using one‐way ANOVA with Tukey multiple comparisons. ***p < 0.001 and ****p < 0.0001. (e) Phagocytosis of pHrodo‐tagged Zymosan A over 24 h (representative images at 24 h) in iMGLs determined by fluorescence intensity. Inhibition of actin polymerization with Cytochalasin D (10 μM, 30 min pre‐treatment) attenuated phagocytosis. n = 4 wells (four images per well, imaged hourly on Incucyte S3). Scale bar, 200 μm. (f) Stimulation of iMGLs with 100 ng/ml LPS for 24 h increased pro‐inflammatory cytokine secretion (n = 4). Data are presented as mean ± SEM using two‐way ANOVA with Sidak's multiple comparisons. n.s., no significance, **p < 0.01, ***p < 0.001, and ****p < 0.0001. (g) Venn diagram showing the number of differentially identified proteins in cell lysates from iNeuron, iMGL, iAstrocyte, and iOligo. (h) Heatmap illustrating the top 30 enriched proteins across the four cell types based on their protein intensity as determined from mass spectrometry. Some common cell type‐specific protein markers were identified in iNeuron (e.g., MAPT), iMGL (e.g., AIF1, PU.1), iAstrocyte (e.g., AQP4), and iOligo (e.g., OLIG2). MAP2, microtubule associated protein2; NeuN, RNA binding Fox‐1 homolog 3; SYP, synaptophysin; TREM2, Triggering Receptor Expressed On Myeloid Cells 2; P2RY12, purinergic receptor P2RY12; GFAP, glial fibrillar acidic protein; APOE, apolipoprotein E; MBP, myelin basic protein; SYT1, synaptotagmin 1; IBA1/AIF1, ionized calcium binding adaptor molecule 1/allograft inflammatory factor 1; PU.1, transcription factor PU.1; S100B, S100 calcium‐binding protein B; ALDH1L1, 10‐formyltetrahydrofolate dehydrogenase; MOG, myelin oligodendrocyte glycoprotein; MBP, myelin basic protein; CNP, 2′,3′‐cyclic nucleotide 3′‐phosphodiesterase; SEM, standard error of the mean; ANOVA, analysis of variances; LPS, lipopolysaccharide; MAPT, microtubule associated protein tau; AQP4, aquaporin 4; OLIG2, oligodendrocyte transcription factor 2
