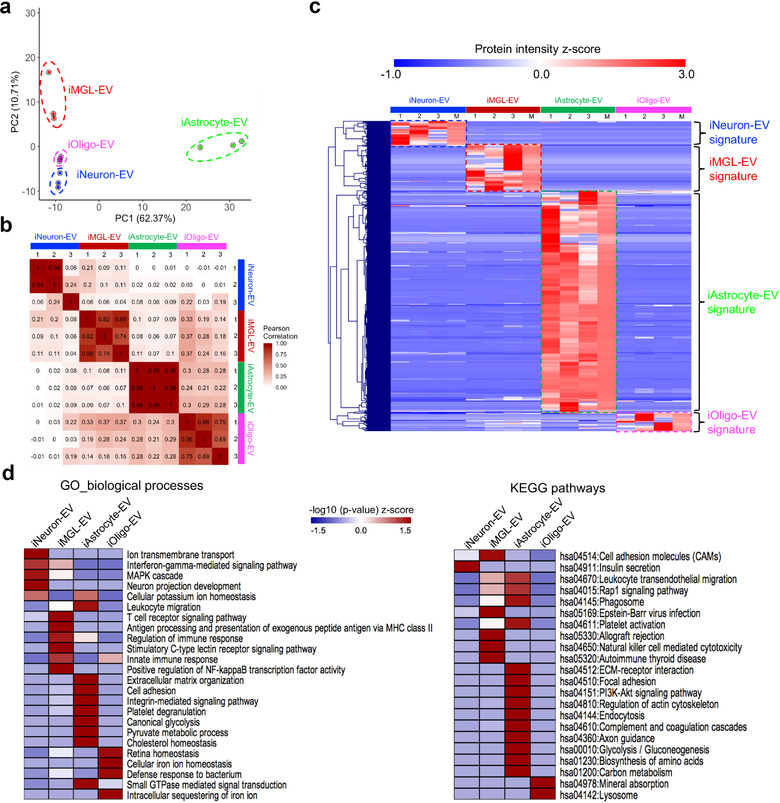
FIGURE 3.

Comparative analysis of the hiPSC‐derived cell‐type‐specific EV proteome. (a) Principal component analysis (PCA). The EV proteome of all cell types and their differentiation states were measured in triplicate and classified into four major cell types based on component 1 (62.37% variability) and component 2 (10.71% variability). (b) Heatmap of the Pearson correlations between each sample, showing high correlation coefficients for the protein intensity determined from the triplicate measurements. (c) Heatmap of the z‐scores for the protein intensities of the cell type‐specific EV proteins after unsupervised hierarchical clustering (n = 3 for each cell type). M represents the median protein abundance of the triplicate measurements. Proteins are divided into four clusters showing the different EV protein signatures across different cell types. (d) Heatmap of the functional enrichments [z‐scored (‐log10 p‐value)] of the EV protein signatures across different cell types for the gene ontology (biological process) terms and KEGG pathways using DAVID Bioinformatics Resources 6.8. PCA, principal component analysis; EV, extracellular vesicle; KEGG, Kyoto Encyclopedia of Genes and Genomes; DAVID, Database for Annotation, Visualization, and Integrated Discovery
