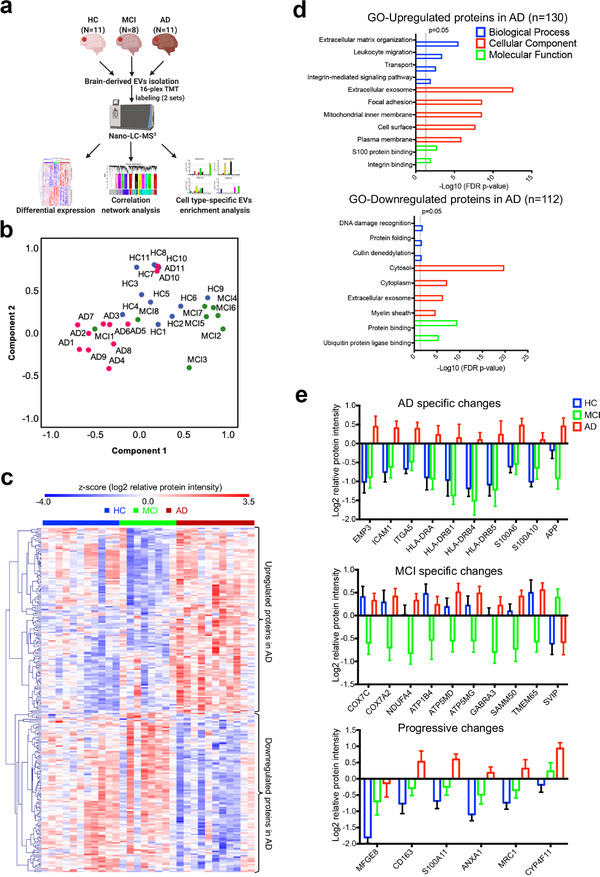
FIGURE 5.

Proteomic analyses of the EVs isolated from the brains of healthy controls, mild cognitive impairment and Alzheimer's disease cases. (a) Graphic illustration of the workflow for brain derived EV proteomes. Brain tissue was sectioned from the postmortem frontal cortex of HC (n = 11), MCI (n = 8), and AD (n = 11) patients for EV isolation. Protein levels were measured and quantified using 16‐plex TMT labelled mass spectrometry and analyzed using differential expression, correlation network analysis, and cell type‐specific EV enrichment analysis. (b) PCA of the total EV samples. HC, blue symbols; MCI, green symbols; AD, red symbols. (c) Heatmap of the z‐scored log2 relative protein intensities within each of the EV sample after unsupervised hierarchical clustering showing the significantly altered proteins in the three comparisons (HC vs. AD, HC vs. MCI, and MCI vs. AD) determined by ANOVA (p < 0.05) followed by Tukey's post hoc test (p < 0.01). Proteins are divided into two clusters showing upregulated and downregulated EV proteins in AD. (d) Gene ontology (GO) analysis of the upregulated and downregulated proteins in AD brain derived EVs by using DAVID Bioinformatics Resources 6.8. The top significant (FDR p‐value < 0.05) GO terms in biological Process, Cellular Component and Molecular Function are listed. (e) List of several significantly differentially expressed proteins (Tukey's post hoc test p < 0.05, fold change over other group > 2) that have AD specific changes, MCI specific changes, and progressive changes across the comparisons of HC, MCI, and AD groups. Data are presented as mean ± SEM. HC, healthy control; MCI, mild cognitive impairment; AD, Alzheimer's disease; EV, extracellular vesicle; TMT, tandem mass tag; PCA, principal component analysis; ANOVA, analysis of variances; GO, gene ontology; DAVID, Database for Annotation, Visualization, and Integrated Discovery; FDR, false discovery rate; SEM, standard error of the mean
