FIGURE 7.

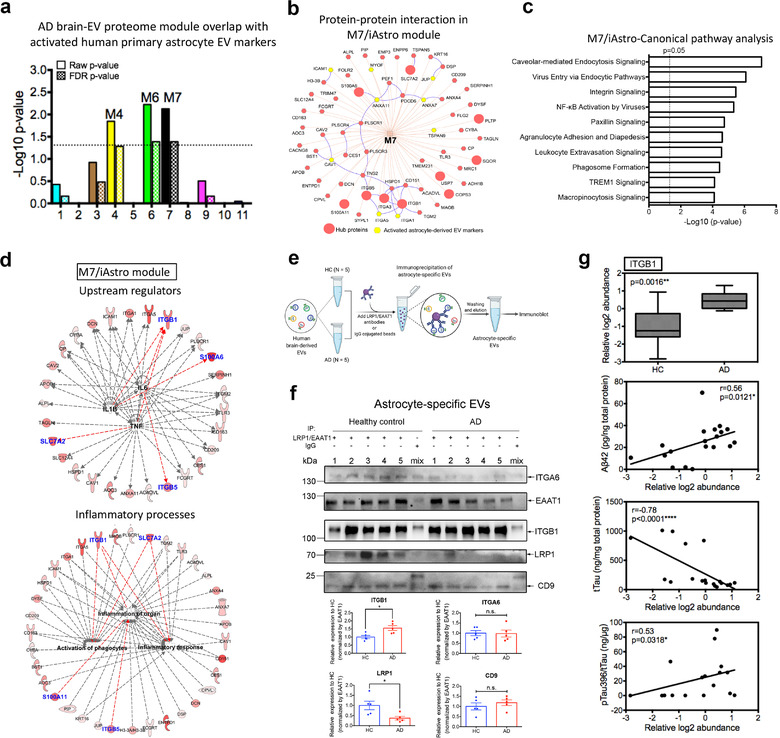
The M7 module is enriched in activated astrocyte derived EV markers and involved in inflammatory processes. (a) The enrichment of proteins, identified as EV markers for the activated astrocytes, was calculated for each module in the AD protein network using a one‐tailed Fisher's exact test. Both the raw p‐value and the FDR p‐value (correction for multiple comparisons by the Benjamini‐Hochberg method) are shown; The dashed line represents a p‐value <0.05, above which enrichment was considered statistically significant. Enrichment was assessed by cross‐referencing module proteins against lists of proteins determined to be differentially expressed in activated astrocyte derived EVs provided in Supplementary Table S16. (b) Protein‐protein interaction network within the M7 module generated by the ToppCluster tool (Kaimal et al., 2010) (https://toppcluster.cchmc.org/). The top 10 hub proteins are ranked by correlation significance with AD traits in the module and are highlighted in the larger red circle. Proteins highlighted in yellow are marker proteins from activated astrocyte derived EVs. (c) Ingenuity canonical pathway analysis of the proteins within the M7 module. The top 10 significantly enriched canonical pathways are listed. A statistically significant p‐value of 0.05 is indicated on the plot as a vertical dashed line, at the x‐value of 1.30. (d) Involvement of the protein co‐expression network within the M7 module in mediating inflammation. These proteins were regulated by potential pro‐inflammatory factors including TNF‐α, IL‐6, and IL‐1β and involved in inflammatory processes including the activation of phagocytes, inflammation of organ and inflammatory responses. The red color indicates the significance of the proteins in the M7 module; Blue indicates the top 10 hub proteins within the module; Red lines indicate leading to activation by a predicted relationship. (e) Schematic of the immunoprecipitation of astrocyte specific EVs from an independent cohort of HC (n = 5) and AD patients (n = 5) for immunoblotting. Combined antibodies against astrocyte‐EV proteins LRP1 and EAAT1 were conjugated to magnetic beads and then added for the immunocapture of astrocyte‐derived EVs. As a negative control, combined mouse and rabbit IgG were used to immunoprecipitate EVs mixed from the HC and AD groups. (f) Western blot analysis of the astrocyte‐specific EVs from the HC and AD patients for the hub protein ITGB1 in the M7/astrocyte‐EV module. The newly identified astrocyte specific EV marker ITGA6, common EV marker CD9, and immunoprecipitated protein EAAT1 and LRP1 were also detected. The original western blot images are shown in Supplementary Figure S9b. Equivalent brain derived EV proteins (30 μg) were isolated from healthy controls and AD patients were used to initiate the immunoprecipitation assay. The ITGB1 level was enriched and significantly elevated in the astrocyte specific EVs from AD when compared to the HC samples (p = 0.032). The LRP1 level was significantly reduced in astrocyte specific EVs from AD when compared to the HC samples (p = 0.032). The western blot signals were calculated using ImageJ and normalized by EAAT1 intensity. Data are presented as mean ± SEM, *p < 0.05, n.s., no significance, and determined using the Mann‐Whitney non‐parametric test. (g) Relative ITGB1 protein level in the human brain‐derived EVs isolated from HC (n = 9) and AD (n = 11) samples using our previously published proteomics dataset (Muraoka, Deleo, et al., 2020) and its correlation with AD pathogenic hallmarks (Aβ42, total tau and pSer396 tau) and evaluated using ELISA kits. The proteomics data and measurements are provided in Supplementary Table S18. Significance in the ITGB1 protein level was measured using a two‐sided Mann‐Whitney t‐test. Correlations were performed using nonparametric Spearman correlation analysis. Box plots represent the median, 25th and 75th percentiles and whiskers indicate the 5th and 95th percentiles, respectively. *p < 0.05, **p < 0.01, ****p < 0.0001. EV, extracellular vesicle; AD, Alzheimer's disease; FDR, false discovery rate; TNF‐α, tumour necrosis factor alpha; IL‐1β, interleukin 1 beta; IL‐6, interleukin 6; HC, healthy control; AD, Alzheimer's disease
