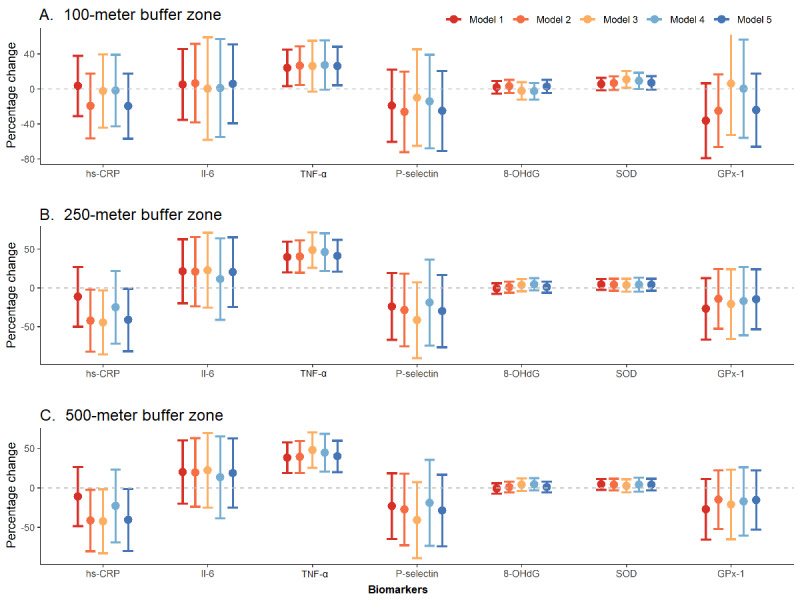
Figure 1.

Percentage change in metabolic biomarker concentrations associated with per IQR increase in normalized difference vegetation index (NDVI) at (A) the 100-meter buffer zone, (B) the 250-meter buffer zone, and (C) the 500-meter buffer zone. Vertical bars are 95% CI. Note: model 1: outcome ~ NDVI; model 2: outcome ~ NDVI + covariates (sex, income, occupation, moderate to vigorous physical activity, noise); model 3: outcome ~ NDVI + covariates + PM2.5; model 4: outcome ~ NDVI + covariates + NO2; model 5: outcome ~ NDVI + covariates + protein + carbohydrates. hs-CRP: high-sensitivity C-reactive protein, IL-6: interleukin-6, TNF-α: tumor necrosis factor α, 8-OHdG: 8-hydroxy-2'-deoxyguanosine, SOD: superoxide dismutase, GPx-1: glutathione peroxidase.
