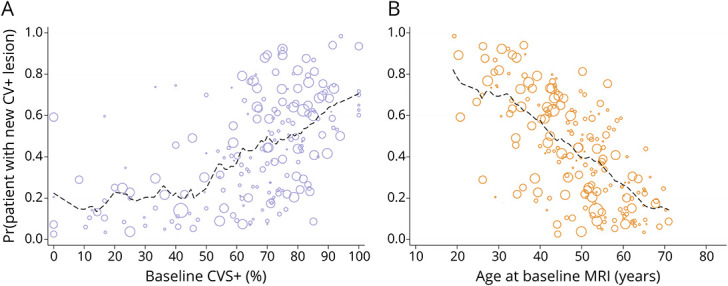
Figure 3. New CVS+ Lesion Development in Multiple Sclerosis Is Associated With Younger Age and Higher Baseline CVS Percentage.

Relationship between fitted probabilities of new CVS+ lesion development generated using multivariate logistic regression, adjusted for age, sex, race, T2*-weighted image gadolinium status, follow-up duration, and baseline CVS+ percentage (A), as well as age at baseline MRI (B). The dimension of each circle is proportional to the duration of MRI follow-up in years. Dashed lines depict a moving average of the probabilities across a span of 10% (A) or 10 years (B). CVS = central vein sign.
